云原生结课project
📝 云原生结课project
顺手上传暑课项目
1. 项目组员信息
| 姓名 | 学号 | 个人贡献 |
|---|---|---|
| 黄睿智 | 231220075 | part3 + 文档编写 |
| 白子敬 | 231220077 | part1 |
| 陈翔宇 | 231220088 | part2 |
2. 限流功能相关的关键代码和说明
2.1 限流系统架构概述
本项目采用基于 Bucket4j + Redis 的分布式限流方案,实现了多层次的流量控制机制:
- 应用层限流:使用 Bucket4j 令牌桶算法
- 连接层限流:Spring Boot Tomcat 连接池限制
- 网络层限流:Kubernetes 网络策略和端口转发限制
2.2 核心限流组件
限流配置类 (RateLimitConfig.java)
1 |
|
限流服务类 (RateLimiterService.java)
1 |
|
限流拦截器 (RateLimitInterceptor.java)
1 |
|
Web 配置类 (WebMvcConfig.java)
1 |
|
2.3 应用配置
application.properties 限流相关配置
1 | spring.application.name=prometheus-test-demo |
2.4 限流工作流程
1 | 用户请求 → Spring MVC → RateLimitInterceptor → RateLimiterService |
2.5 限流算法说明
令牌桶算法 (Token Bucket Algorithm):
- 初始化:创建容量为100的令牌桶
- 令牌补充:每秒向桶中添加100个令牌
- 请求处理:每个请求尝试消费1个令牌
- 限流判断:
- 有令牌:允许请求,消费令牌
- 无令牌:拒绝请求,返回429状态码
3. Dockerfile及K8s 编排文件
3.1 Dockerfile
1 | # 第一阶段:构建阶段 - 统一使用Java 11 |
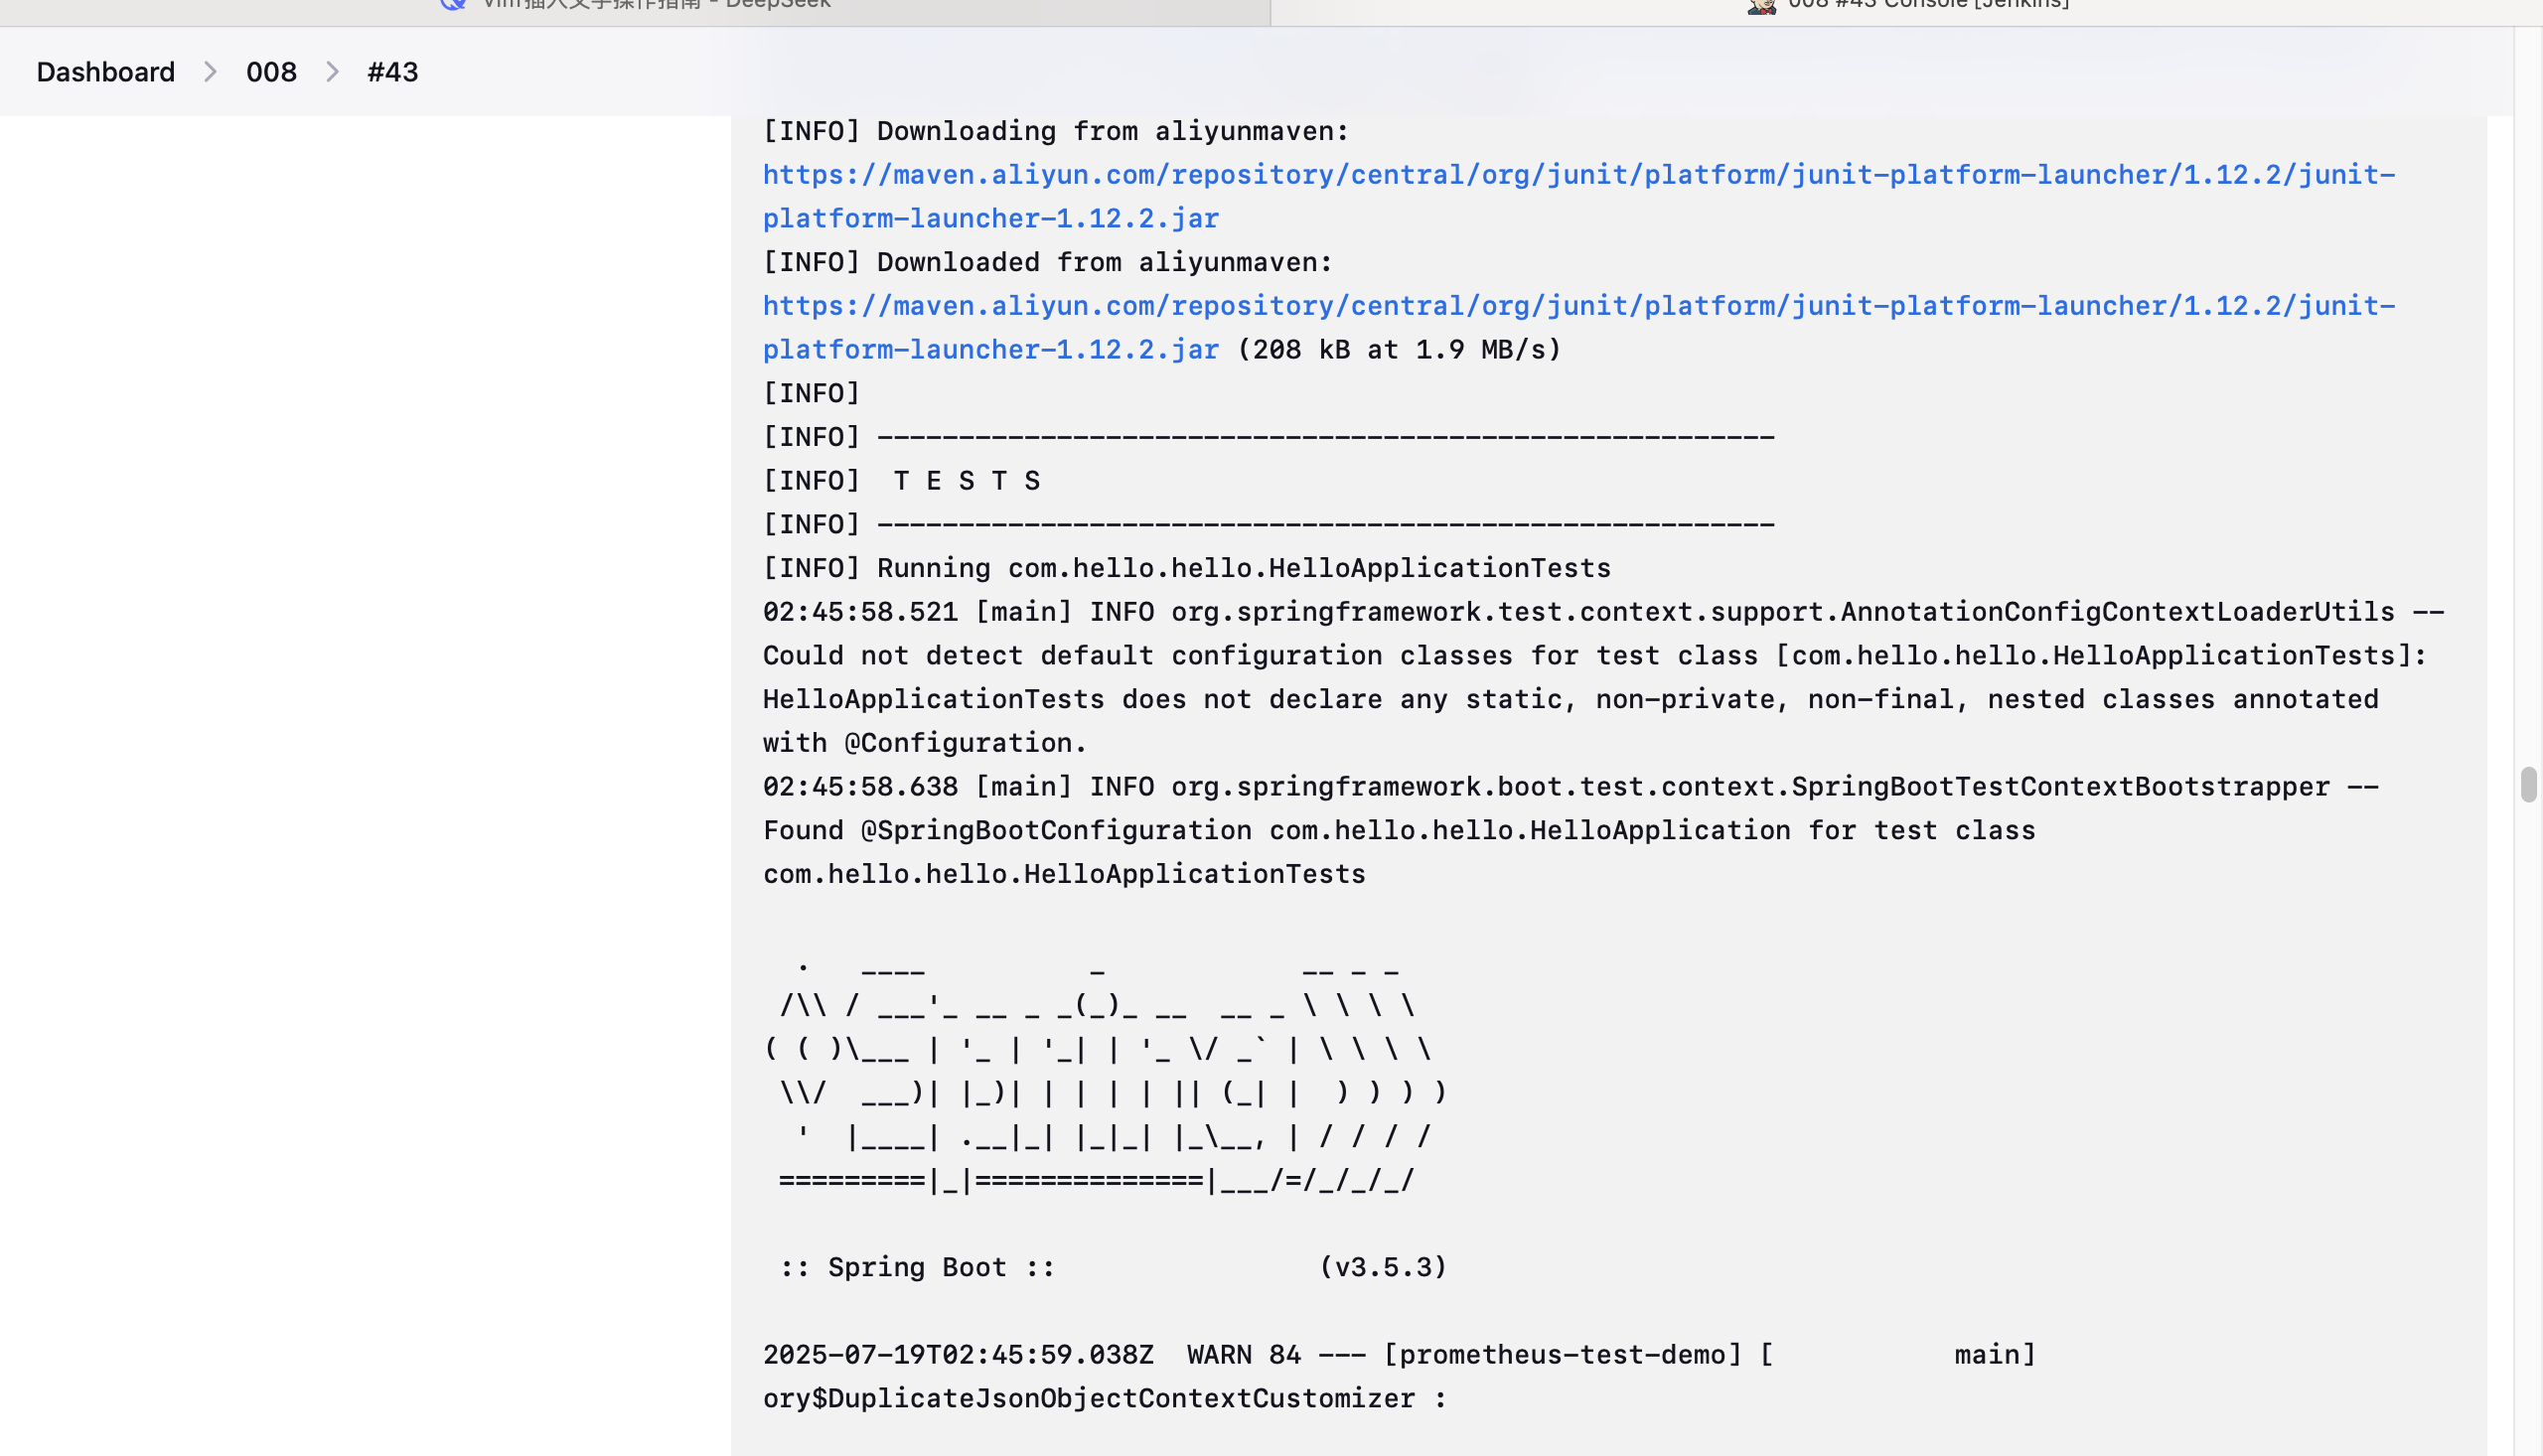
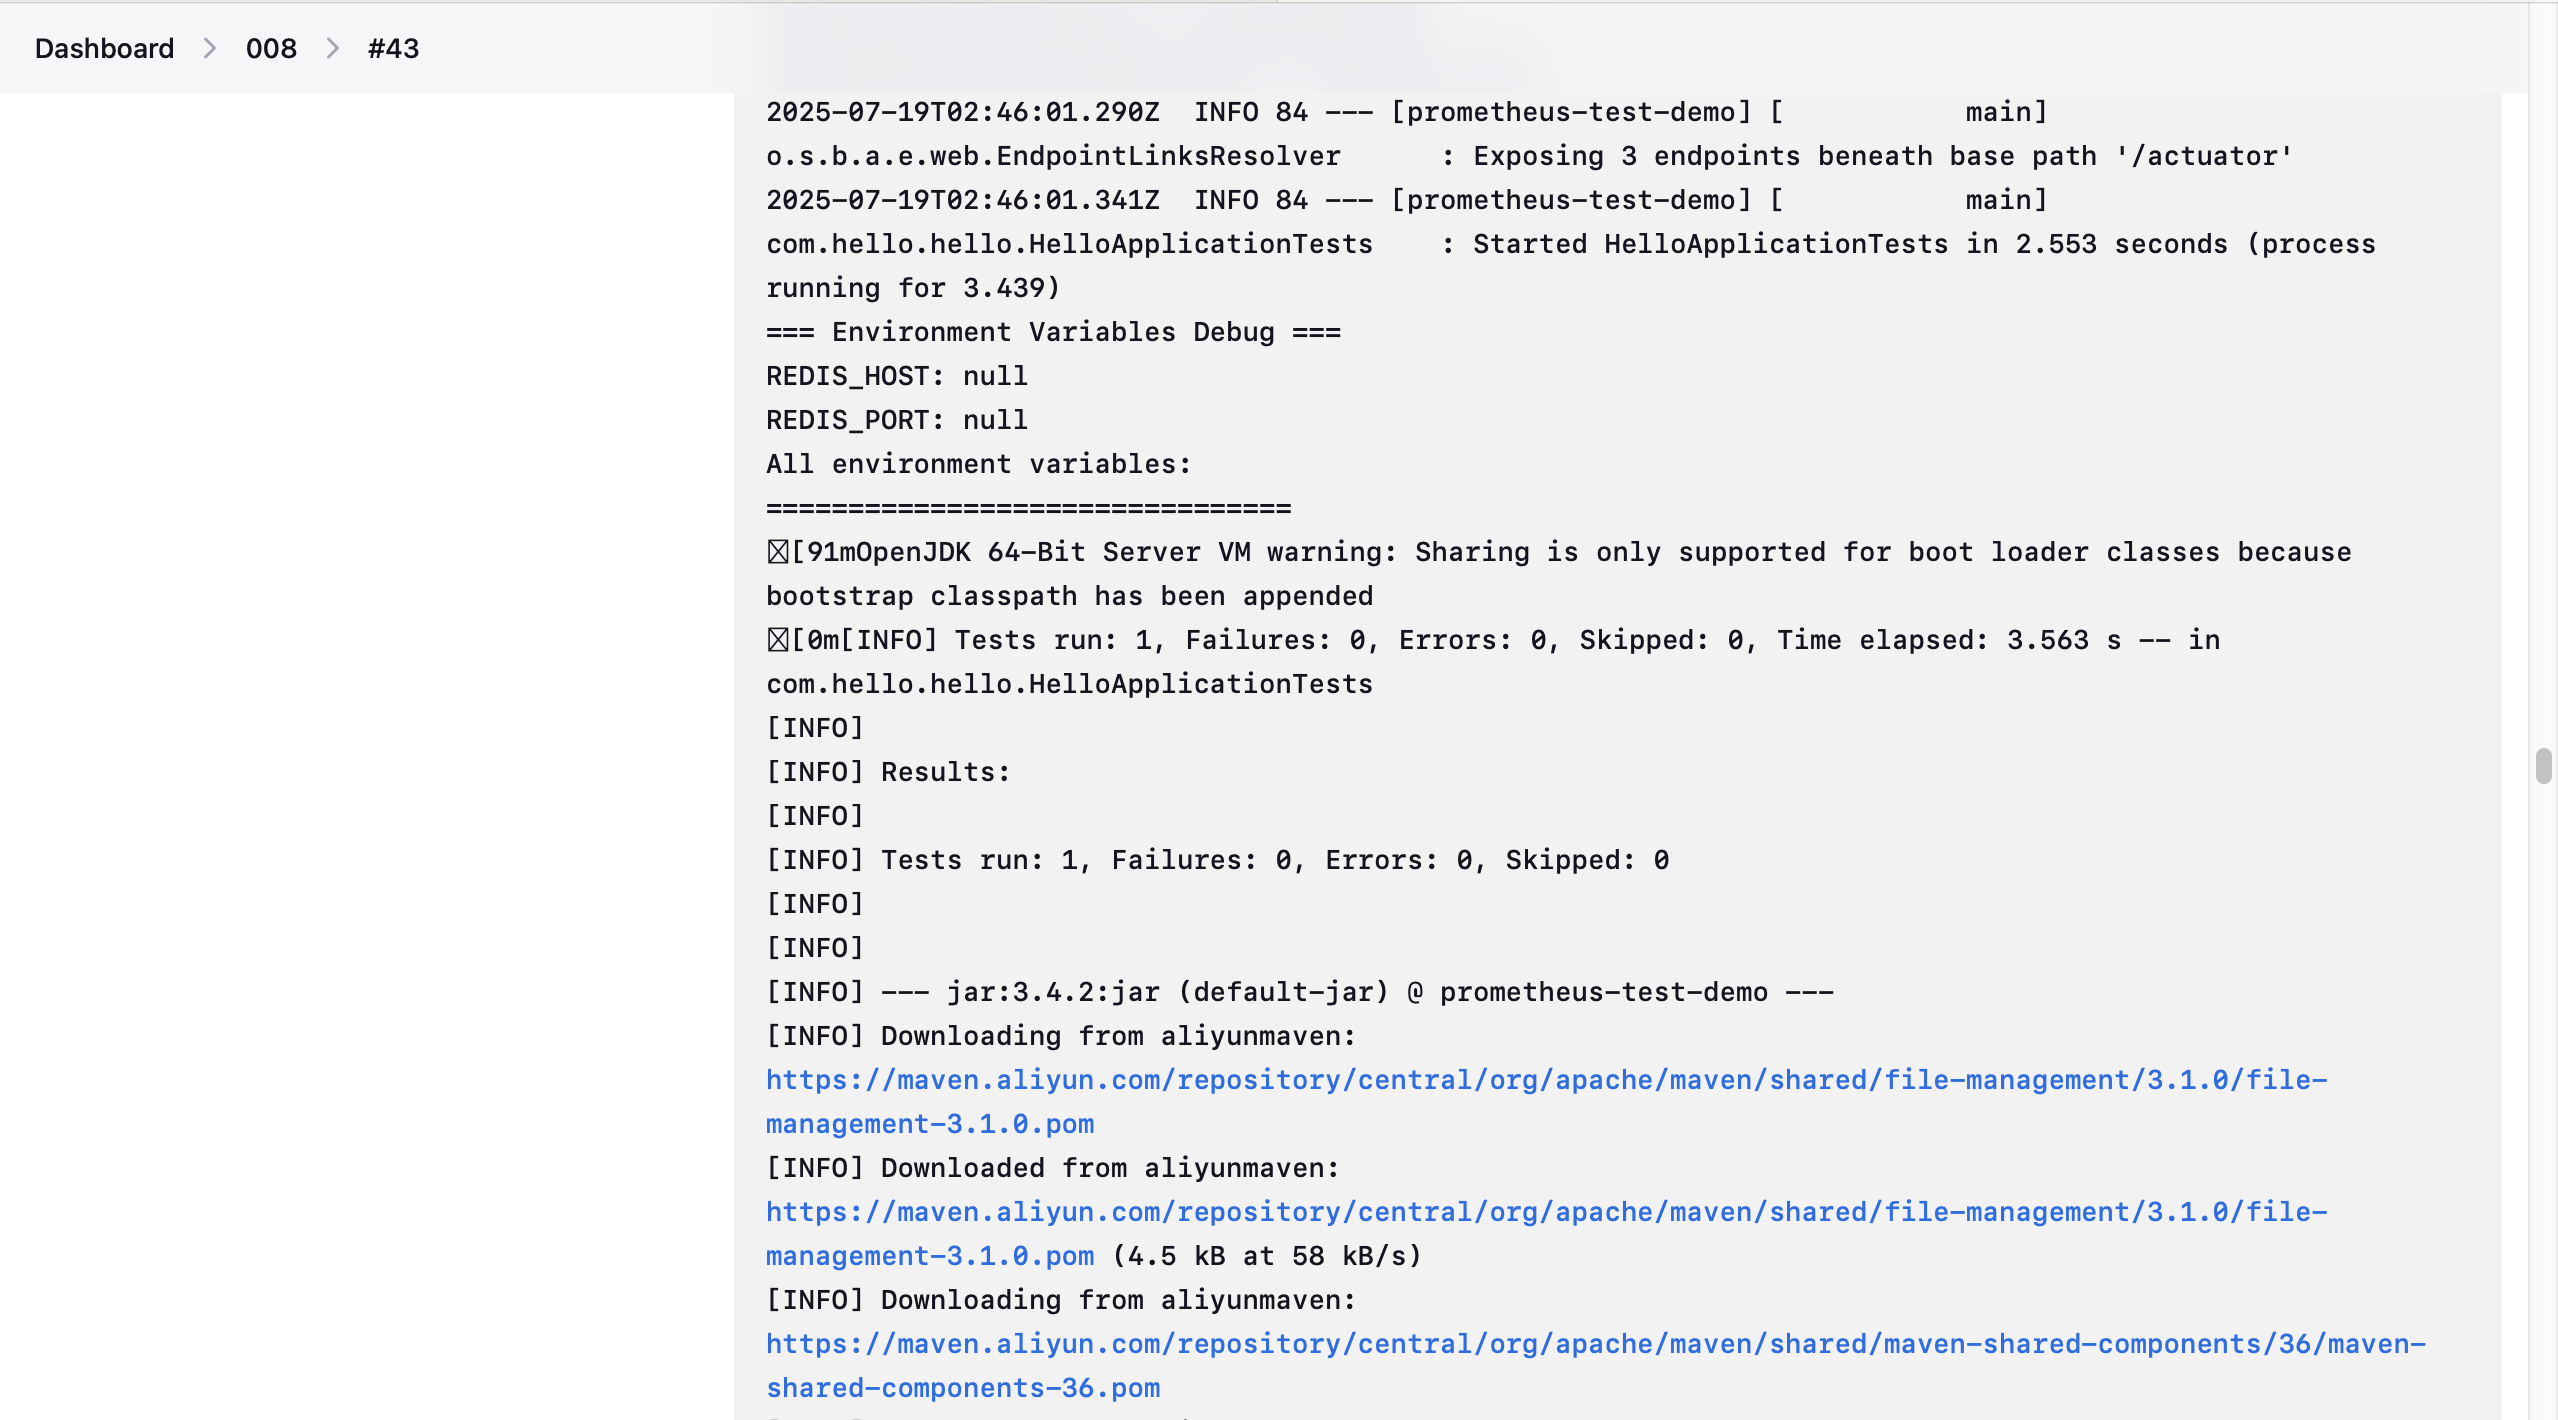
Dockerfile 设计说明:
- 构建项目时删去原demo的 -DskipTests 参数,直接运行测试样例,因此在 Jenkinsfile 中不再执行test。
- 下图为测试运行结果
3.2 Kubernetes 部署文件 (prometheus-test-demo.yaml)
1 | apiVersion: apps/v1 |
K8s 配置说明:
- 使用 InitContainer 确保 Redis 先启动
- 配置了资源限制防止资源耗尽
- 设置了健康检查确保服务可用
3.3 ServiceMonitor 配置 (prometheus-test-serviceMonitor.yaml)
1 | apiVersion: monitoring.coreos.com/v1 |
4. Jenkins 持续集成、持续部署、持续测试配置文件与说明
4.1 Jenkinsfile 完整配置
1 | pipeline { |
4.2 Jenkins 流水线说明
流水线各阶段详解:
Checkout 阶段:
- 拉取源代码
- 生成构建版本号
Build 阶段:
- Maven 编译和测试
- 生成构建产物
Docker Build & Push 阶段:
- 构建容器镜像
- 推送到镜像仓库
Deploy to Kubernetes 阶段:
- 配置 K8s 部署文件
- 部署应用和依赖服务
- 健康检查
4.3 CI/CD 流程验证截图位置
镜像构建截图: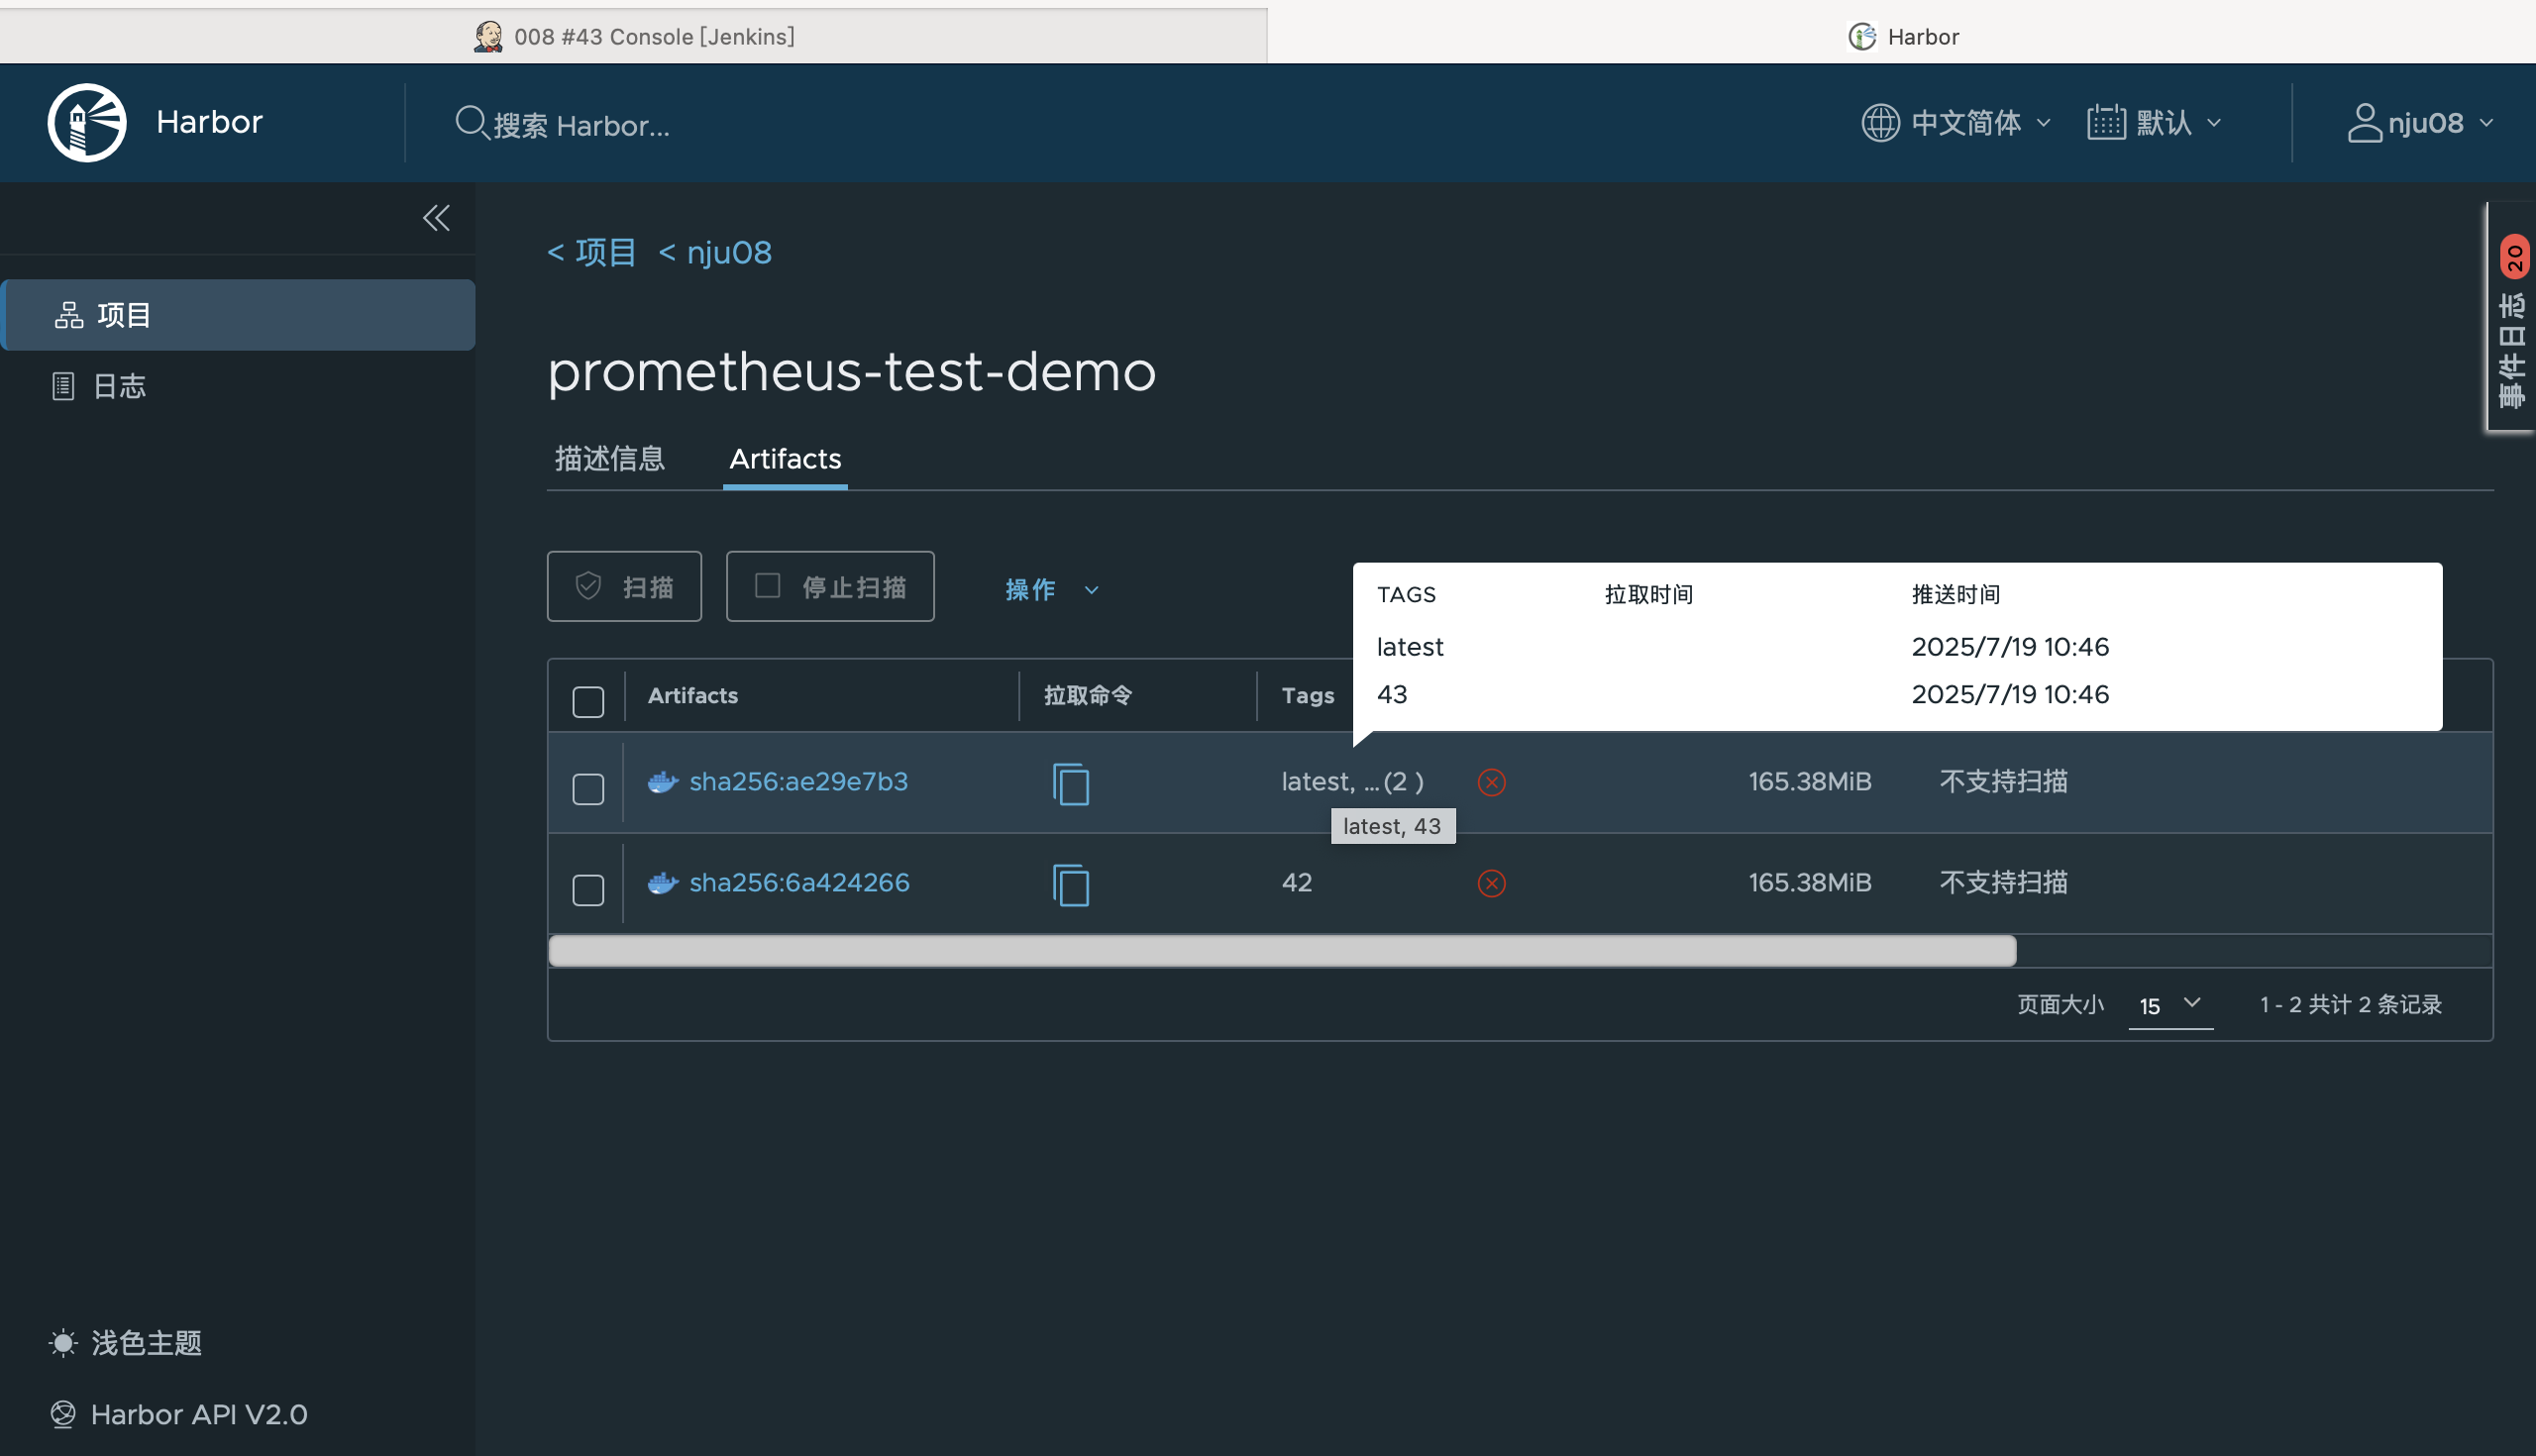
构建成功截图: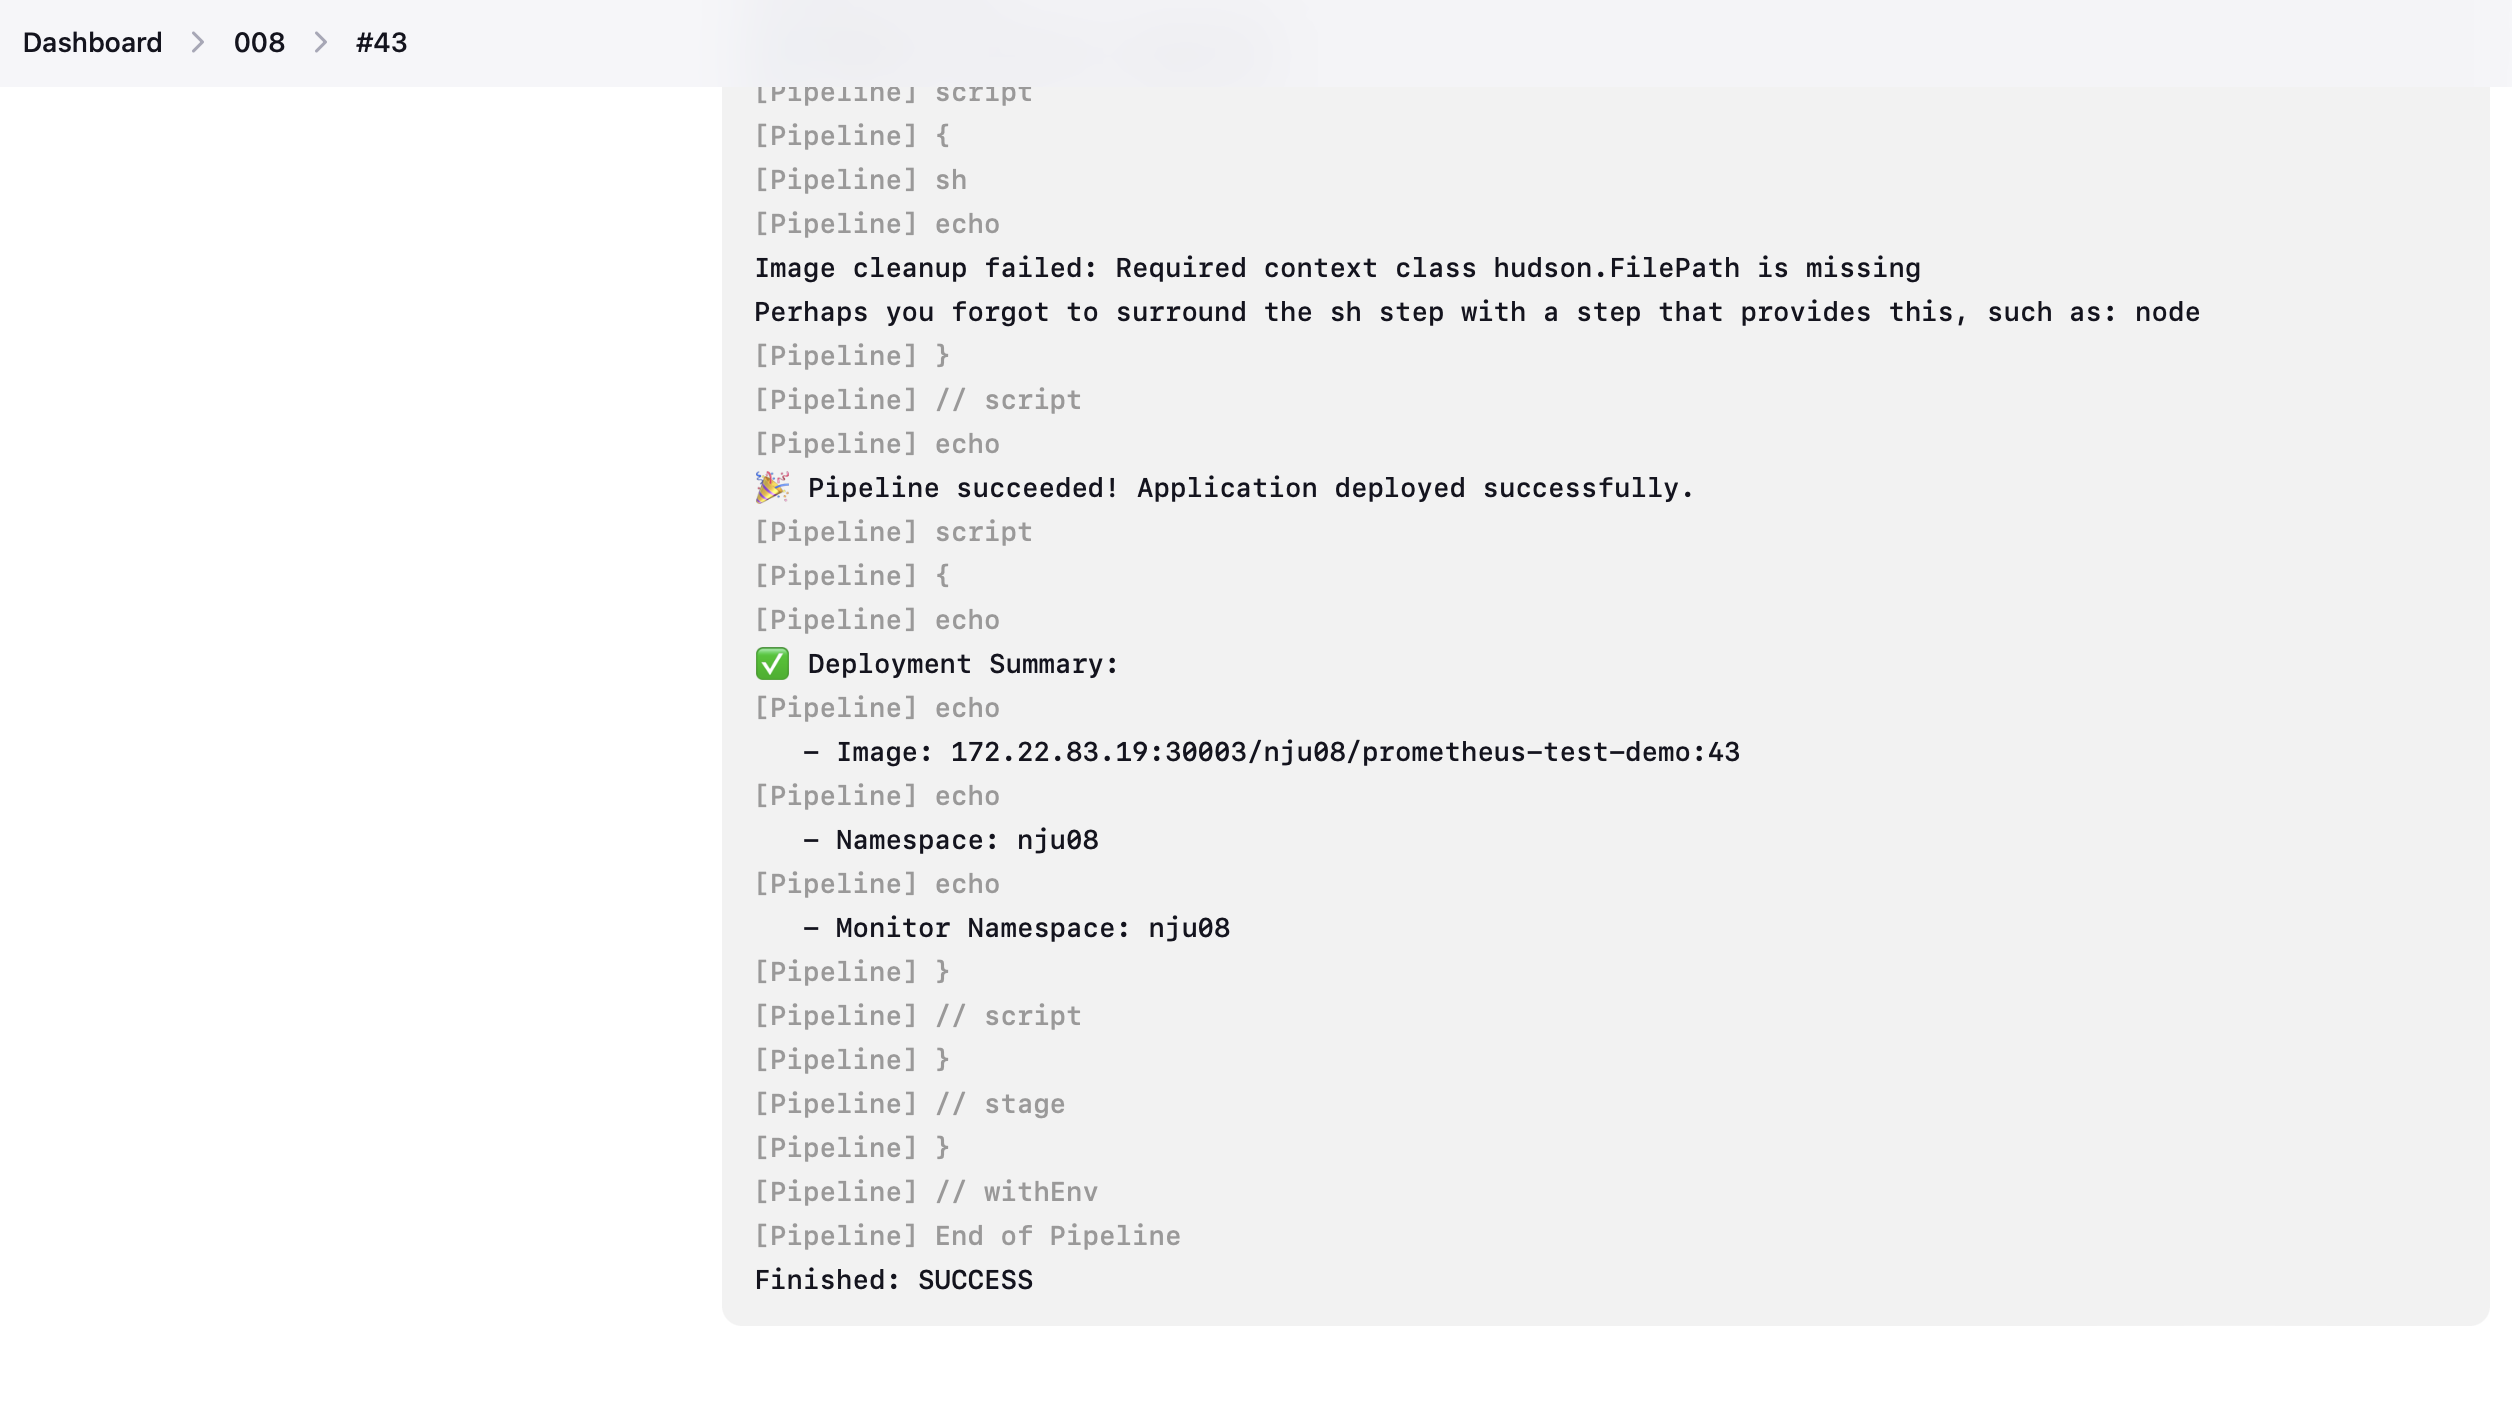
部署成功截图: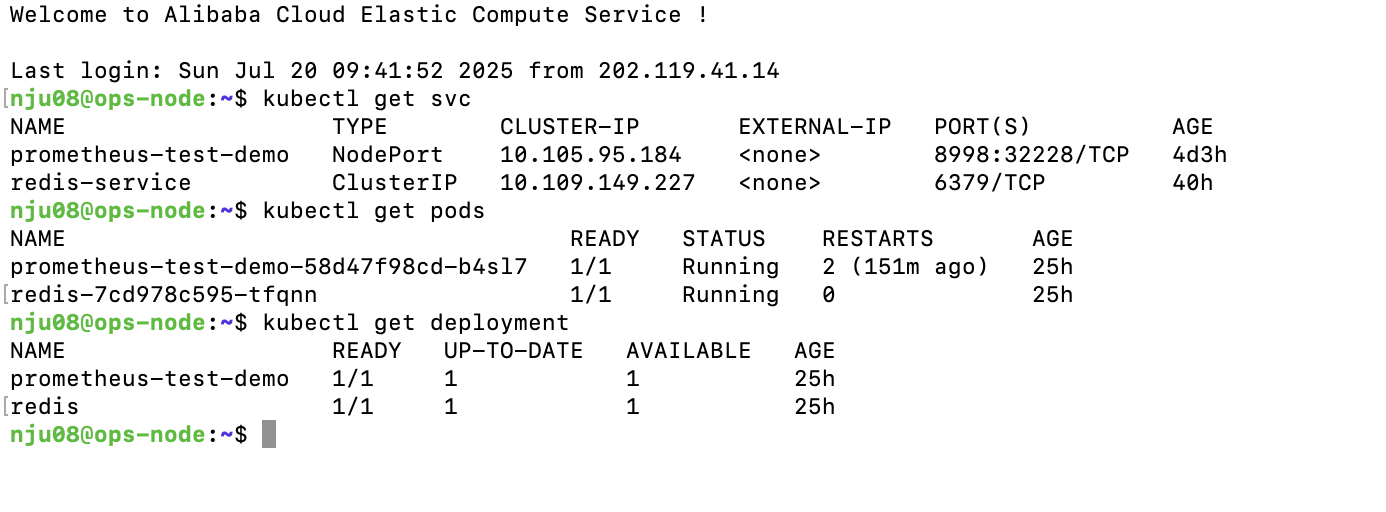
5. 监控指标采集的配置及说明;Grafana 监控大屏截图
5.1 Prometheus 监控配置
5.1.1 应用监控注解配置
应用 Pod 配置了 Prometheus 自动发现注解:
1 | annotations: |
5.1.2 ServiceMonitor 配置
1 | apiVersion: monitoring.coreos.com/v1 |
5.2 关键监控指标
5.2.1 应用性能指标
HTTP 请求指标:
http_server_requests_seconds_count- 请求总数http_server_requests_seconds_sum- 请求总耗时http_server_requests_seconds_max- 最大响应时间
JVM 指标:
jvm_memory_used_bytes- JVM 内存使用jvm_gc_pause_seconds- GC 暂停时间jvm_threads_live_threads- 活跃线程数
5.2.2 限流相关指标
Bucket4j 指标(如果配置了 Micrometer 集成):
bucket4j_consumed_tokens_total- 消费的令牌总数bucket4j_rejected_requests_total- 被拒绝的请求数bucket4j_available_tokens- 可用令牌数
Tomcat 连接池指标:
tomcat_sessions_active_current- 活跃会话数tomcat_threads_busy_threads- 繁忙线程数tomcat_threads_config_max_threads- 最大线程数
指标监测:
- 端口转发之后
curl http://localhost:8998/actuator/prometheus,得到详细数据。
1
2
3
4
5
6
7
8
9
10
11
12
13
14
15
16
17
18
19
20
21
22
23
24
25
26
27
28
29
30
31
32
33
34
35
36
37
38
39
40
41
42
43
44
45
46
47
48
49
50
51
52
53
54
55
56
57
58
59
60
61
62
63
64
65
66
67
68
69
70
71
72
73
74
75
76
77
78
79
80
81
82
83
84
85
86
87
88
89
90
91
92
93
94
95
96
97
98
99
100
101
102
103
104
105
106
107
108
109
110
111
112
113
114
115
116
117
118
119
120
121
122
123
124
125
126
127
128
129
130
131
132
133
134
135
136
137
138
139
140
141
142
143
144
145
146
147
148
149
150
151
152
153
154
155
156
157
158
159
160
161
162
163
164
165
166
167
168
169
170
171
172
173
174
175
176
177
178
179
180
181
182
183
184
185
186
187
188
189
190
191
192
193
194
195
196
197
198
199
200
201
202
203
204
205
206
207
208
209
210# HELP application_ready_time_seconds Time taken for the application to be ready to service requests
# TYPE application_ready_time_seconds gauge
application_ready_time_seconds{main_application_class="com.hello.hello.HelloApplication"} 47.994
# HELP application_started_time_seconds Time taken to start the application
# TYPE application_started_time_seconds gauge
application_started_time_seconds{main_application_class="com.hello.hello.HelloApplication"} 47.787
# HELP disk_free_bytes Usable space for path
# TYPE disk_free_bytes gauge
disk_free_bytes{path="/app/."} 4.1373339648E10
# HELP disk_total_bytes Total space for path
# TYPE disk_total_bytes gauge
disk_total_bytes{path="/app/."} 5.36608768E10
# HELP executor_active_threads The approximate number of threads that are actively executing tasks
# TYPE executor_active_threads gauge
executor_active_threads{name="applicationTaskExecutor"} 0.0
# HELP executor_completed_tasks_total The approximate total number of tasks that have completed execution
# TYPE executor_completed_tasks_total counter
executor_completed_tasks_total{name="applicationTaskExecutor"} 0.0
# HELP executor_pool_core_threads The core number of threads for the pool
# TYPE executor_pool_core_threads gauge
executor_pool_core_threads{name="applicationTaskExecutor"} 8.0
# HELP executor_pool_max_threads The maximum allowed number of threads in the pool
# TYPE executor_pool_max_threads gauge
executor_pool_max_threads{name="applicationTaskExecutor"} 2.147483647E9
# HELP executor_pool_size_threads The current number of threads in the pool
# TYPE executor_pool_size_threads gauge
executor_pool_size_threads{name="applicationTaskExecutor"} 0.0
# HELP executor_queue_remaining_tasks The number of additional elements that this queue can ideally accept without blocking
# TYPE executor_queue_remaining_tasks gauge
executor_queue_remaining_tasks{name="applicationTaskExecutor"} 2.147483647E9
# HELP executor_queued_tasks The approximate number of tasks that are queued for execution
# TYPE executor_queued_tasks gauge
executor_queued_tasks{name="applicationTaskExecutor"} 0.0
# HELP http_server_requests_active_seconds
# TYPE http_server_requests_active_seconds summary
http_server_requests_active_seconds_count{exception="none",method="GET",outcome="SUCCESS",status="200",uri="UNKNOWN"} 1
http_server_requests_active_seconds_sum{exception="none",method="GET",outcome="SUCCESS",status="200",uri="UNKNOWN"} 0.194124977
# HELP http_server_requests_active_seconds_max
# TYPE http_server_requests_active_seconds_max gauge
http_server_requests_active_seconds_max{exception="none",method="GET",outcome="SUCCESS",status="200",uri="UNKNOWN"} 0.262306658
# HELP http_server_requests_seconds
# TYPE http_server_requests_seconds summary
http_server_requests_seconds_count{error="IOException",exception="IOException",method="GET",outcome="SUCCESS",status="200",uri="/hello"} 77
http_server_requests_seconds_sum{error="IOException",exception="IOException",method="GET",outcome="SUCCESS",status="200",uri="/hello"} 588.946979862
http_server_requests_seconds_count{error="none",exception="none",method="GET",outcome="SUCCESS",status="200",uri="/actuator/health"} 1314
http_server_requests_seconds_sum{error="none",exception="none",method="GET",outcome="SUCCESS",status="200",uri="/actuator/health"} 8.224338786
http_server_requests_seconds_count{error="none",exception="none",method="GET",outcome="SUCCESS",status="200",uri="/hello"} 4708
http_server_requests_seconds_sum{error="none",exception="none",method="GET",outcome="SUCCESS",status="200",uri="/hello"} 15666.990410086
# HELP http_server_requests_seconds_max
# TYPE http_server_requests_seconds_max gauge
http_server_requests_seconds_max{error="IOException",exception="IOException",method="GET",outcome="SUCCESS",status="200",uri="/hello"} 0.0
http_server_requests_seconds_max{error="none",exception="none",method="GET",outcome="SUCCESS",status="200",uri="/actuator/health"} 0.003561359
http_server_requests_seconds_max{error="none",exception="none",method="GET",outcome="SUCCESS",status="200",uri="/hello"} 0.0
# HELP jvm_info JVM version info
# TYPE jvm_info gauge
jvm_info{runtime="OpenJDK Runtime Environment",vendor="Eclipse Adoptium",version="17.0.11+9"} 1
# HELP jvm_buffer_count_buffers An estimate of the number of buffers in the pool
# TYPE jvm_buffer_count_buffers gauge
jvm_buffer_count_buffers{id="direct"} 12.0
jvm_buffer_count_buffers{id="mapped"} 0.0
jvm_buffer_count_buffers{id="mapped - 'non-volatile memory'"} 0.0
# HELP jvm_buffer_memory_used_bytes An estimate of the memory that the Java virtual machine is using for this buffer pool
# TYPE jvm_buffer_memory_used_bytes gauge
jvm_buffer_memory_used_bytes{id="direct"} 100352.0
jvm_buffer_memory_used_bytes{id="mapped"} 0.0
jvm_buffer_memory_used_bytes{id="mapped - 'non-volatile memory'"} 0.0
# HELP jvm_buffer_total_capacity_bytes An estimate of the total capacity of the buffers in this pool
# TYPE jvm_buffer_total_capacity_bytes gauge
jvm_buffer_total_capacity_bytes{id="direct"} 100352.0
jvm_buffer_total_capacity_bytes{id="mapped"} 0.0
jvm_buffer_total_capacity_bytes{id="mapped - 'non-volatile memory'"} 0.0
# HELP jvm_classes_loaded_classes The number of classes that are currently loaded in the Java virtual machine
# TYPE jvm_classes_loaded_classes gauge
jvm_classes_loaded_classes 10568.0
# HELP jvm_classes_unloaded_classes_total The number of classes unloaded in the Java virtual machine
# TYPE jvm_classes_unloaded_classes_total counter
jvm_classes_unloaded_classes_total 80.0
# HELP jvm_compilation_time_ms_total The approximate accumulated elapsed time spent in compilation
# TYPE jvm_compilation_time_ms_total counter
jvm_compilation_time_ms_total{compiler="HotSpot 64-Bit Tiered Compilers"} 218885.0
# HELP jvm_gc_live_data_size_bytes Size of long-lived heap memory pool after reclamation
# TYPE jvm_gc_live_data_size_bytes gauge
jvm_gc_live_data_size_bytes 8.5416936E7
# HELP jvm_gc_max_data_size_bytes Max size of long-lived heap memory pool
# TYPE jvm_gc_max_data_size_bytes gauge
jvm_gc_max_data_size_bytes 2.68435456E8
# HELP jvm_gc_memory_allocated_bytes_total Incremented for an increase in the size of the (young) heap memory pool after one GC to before the next
# TYPE jvm_gc_memory_allocated_bytes_total counter
jvm_gc_memory_allocated_bytes_total 4.95829704E8
# HELP jvm_gc_memory_promoted_bytes_total Count of positive increases in the size of the old generation memory pool before GC to after GC
# TYPE jvm_gc_memory_promoted_bytes_total counter
jvm_gc_memory_promoted_bytes_total 7.1289304E7
# HELP jvm_gc_overhead An approximation of the percent of CPU time used by GC activities over the last lookback period or since monitoring began, whichever is shorter, in the range [0..1]
# TYPE jvm_gc_overhead gauge
jvm_gc_overhead 0.0
# HELP jvm_gc_pause_seconds Time spent in GC pause
# TYPE jvm_gc_pause_seconds summary
jvm_gc_pause_seconds_count{action="end of major GC",cause="Allocation Failure",gc="MarkSweepCompact"} 3
jvm_gc_pause_seconds_sum{action="end of major GC",cause="Allocation Failure",gc="MarkSweepCompact"} 0.976
jvm_gc_pause_seconds_count{action="end of minor GC",cause="Allocation Failure",gc="Copy"} 16
jvm_gc_pause_seconds_sum{action="end of minor GC",cause="Allocation Failure",gc="Copy"} 1.047
# HELP jvm_gc_pause_seconds_max Time spent in GC pause
# TYPE jvm_gc_pause_seconds_max gauge
jvm_gc_pause_seconds_max{action="end of major GC",cause="Allocation Failure",gc="MarkSweepCompact"} 0.0
jvm_gc_pause_seconds_max{action="end of minor GC",cause="Allocation Failure",gc="Copy"} 0.0
# HELP jvm_memory_committed_bytes The amount of memory in bytes that is committed for the Java virtual machine to use
# TYPE jvm_memory_committed_bytes gauge
jvm_memory_committed_bytes{area="heap",id="Eden Space"} 5.7081856E7
jvm_memory_committed_bytes{area="heap",id="Survivor Space"} 7077888.0
jvm_memory_committed_bytes{area="heap",id="Tenured Gen"} 1.42364672E8
jvm_memory_committed_bytes{area="nonheap",id="CodeHeap 'non-nmethods'"} 2555904.0
jvm_memory_committed_bytes{area="nonheap",id="CodeHeap 'non-profiled nmethods'"} 5636096.0
jvm_memory_committed_bytes{area="nonheap",id="CodeHeap 'profiled nmethods'"} 1.572864E7
jvm_memory_committed_bytes{area="nonheap",id="Compressed Class Space"} 6815744.0
jvm_memory_committed_bytes{area="nonheap",id="Metaspace"} 5.1707904E7
# HELP jvm_memory_max_bytes The maximum amount of memory in bytes that can be used for memory management
# TYPE jvm_memory_max_bytes gauge
jvm_memory_max_bytes{area="heap",id="Eden Space"} 1.0747904E8
jvm_memory_max_bytes{area="heap",id="Survivor Space"} 1.3369344E7
jvm_memory_max_bytes{area="heap",id="Tenured Gen"} 2.68435456E8
jvm_memory_max_bytes{area="nonheap",id="CodeHeap 'non-nmethods'"} 5828608.0
jvm_memory_max_bytes{area="nonheap",id="CodeHeap 'non-profiled nmethods'"} 1.22916864E8
jvm_memory_max_bytes{area="nonheap",id="CodeHeap 'profiled nmethods'"} 1.22912768E8
jvm_memory_max_bytes{area="nonheap",id="Compressed Class Space"} 1.073741824E9
jvm_memory_max_bytes{area="nonheap",id="Metaspace"} -1.0
# HELP jvm_memory_usage_after_gc The percentage of long-lived heap pool used after the last GC event, in the range [0..1]
# TYPE jvm_memory_usage_after_gc gauge
jvm_memory_usage_after_gc{area="heap",pool="long-lived"} 0.3310730457305908
# HELP jvm_memory_used_bytes The amount of used memory
# TYPE jvm_memory_used_bytes gauge
jvm_memory_used_bytes{area="heap",id="Eden Space"} 3.3653184E7
jvm_memory_used_bytes{area="heap",id="Survivor Space"} 854168.0
jvm_memory_used_bytes{area="heap",id="Tenured Gen"} 8.8871744E7
jvm_memory_used_bytes{area="nonheap",id="CodeHeap 'non-nmethods'"} 1349248.0
jvm_memory_used_bytes{area="nonheap",id="CodeHeap 'non-profiled nmethods'"} 5586048.0
jvm_memory_used_bytes{area="nonheap",id="CodeHeap 'profiled nmethods'"} 1.5632E7
jvm_memory_used_bytes{area="nonheap",id="Compressed Class Space"} 6518344.0
jvm_memory_used_bytes{area="nonheap",id="Metaspace"} 5.1187048E7
# HELP jvm_threads_daemon_threads The current number of live daemon threads
# TYPE jvm_threads_daemon_threads gauge
jvm_threads_daemon_threads 20.0
# HELP jvm_threads_live_threads The current number of live threads including both daemon and non-daemon threads
# TYPE jvm_threads_live_threads gauge
jvm_threads_live_threads 24.0
# HELP jvm_threads_peak_threads The peak live thread count since the Java virtual machine started or peak was reset
# TYPE jvm_threads_peak_threads gauge
jvm_threads_peak_threads 214.0
# HELP jvm_threads_started_threads_total The total number of application threads started in the JVM
# TYPE jvm_threads_started_threads_total counter
jvm_threads_started_threads_total 249.0
# HELP jvm_threads_states_threads The current number of threads
# TYPE jvm_threads_states_threads gauge
jvm_threads_states_threads{state="blocked"} 0.0
jvm_threads_states_threads{state="new"} 0.0
jvm_threads_states_threads{state="runnable"} 7.0
jvm_threads_states_threads{state="terminated"} 0.0
jvm_threads_states_threads{state="timed-waiting"} 6.0
jvm_threads_states_threads{state="waiting"} 11.0
# HELP logback_events_total Number of log events that were enabled by the effective log level
# TYPE logback_events_total counter
logback_events_total{level="debug"} 0.0
logback_events_total{level="error"} 0.0
logback_events_total{level="info"} 5.0
logback_events_total{level="trace"} 0.0
logback_events_total{level="warn"} 0.0
# HELP process_cpu_time_ns_total The "cpu time" used by the Java Virtual Machine process
# TYPE process_cpu_time_ns_total counter
process_cpu_time_ns_total 1.0813E11
# HELP process_cpu_usage The "recent cpu usage" for the Java Virtual Machine process
# TYPE process_cpu_usage gauge
process_cpu_usage 0.09197856413746172
# HELP process_files_max_files The maximum file descriptor count
# TYPE process_files_max_files gauge
process_files_max_files 1048576.0
# HELP process_files_open_files The open file descriptor count
# TYPE process_files_open_files gauge
process_files_open_files 15.0
# HELP process_start_time_seconds Start time of the process since unix epoch.
# TYPE process_start_time_seconds gauge
process_start_time_seconds 1.752976768479E9
# HELP process_uptime_seconds The uptime of the Java virtual machine
# TYPE process_uptime_seconds gauge
process_uptime_seconds 9948.976
# HELP system_cpu_count The number of processors available to the Java virtual machine
# TYPE system_cpu_count gauge
system_cpu_count 1.0
# HELP system_cpu_usage The "recent cpu usage" of the system the application is running in
# TYPE system_cpu_usage gauge
system_cpu_usage 0.09208738261313372
# HELP system_load_average_1m The sum of the number of runnable entities queued to available processors and the number of runnable entities running on the available processors averaged over a period of time
# TYPE system_load_average_1m gauge
system_load_average_1m 0.08
# HELP tomcat_sessions_active_current_sessions
# TYPE tomcat_sessions_active_current_sessions gauge
tomcat_sessions_active_current_sessions 0.0
# HELP tomcat_sessions_active_max_sessions
# TYPE tomcat_sessions_active_max_sessions gauge
tomcat_sessions_active_max_sessions 0.0
# HELP tomcat_sessions_alive_max_seconds
# TYPE tomcat_sessions_alive_max_seconds gauge
tomcat_sessions_alive_max_seconds 0.0
# HELP tomcat_sessions_created_sessions_total
# TYPE tomcat_sessions_created_sessions_total counter
tomcat_sessions_created_sessions_total 0.0
# HELP tomcat_sessions_expired_sessions_total
# TYPE tomcat_sessions_expired_sessions_total counter
tomcat_sessions_expired_sessions_total 0.0
# HELP tomcat_sessions_rejected_sessions_total
# TYPE tomcat_sessions_rejected_sessions_total counter
tomcat_sessions_rejected_sessions_total 0.0- 端口转发之后
5.3 Grafana 监控大屏配置
5.3.1 监控大屏概览
本项目成功配置了多个 Grafana 监控大屏,涵盖了应用性能、网络流量和资源使用等关键指标:
- SpringBoot APM Dashboard - 应用性能监控
- Kubernetes / Compute Resources / Namespace - 集群资源监控
- 网络流量监控面板 - Pod 间通信监控
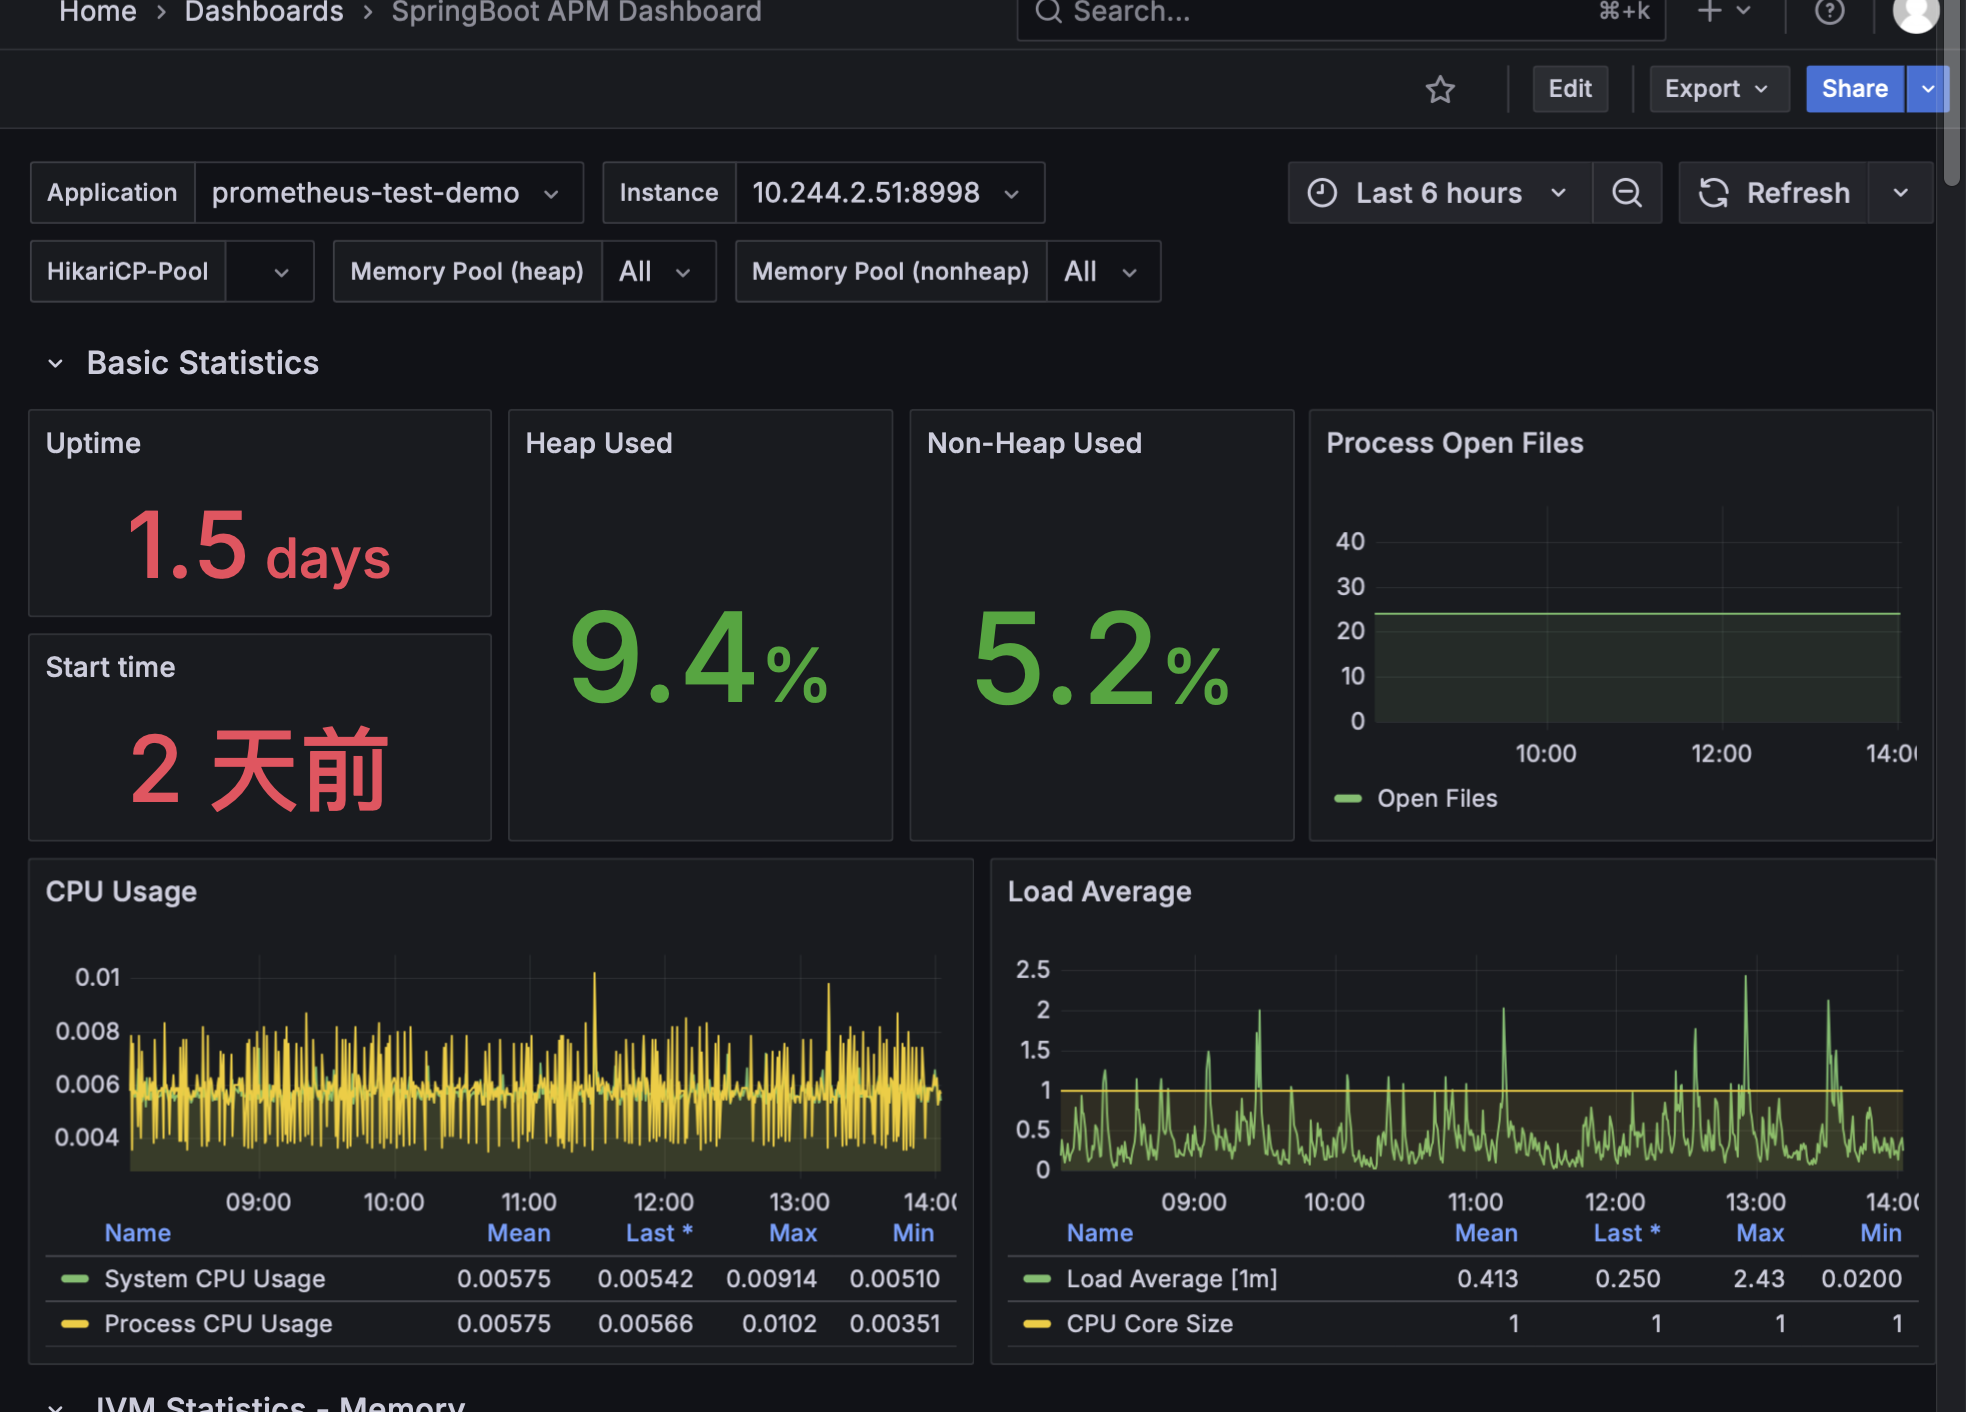
5.3.2 SpringBoot APM Dashboard 配置
面板配置说明:
1 | { |
关键监控指标:
- 运行时间: 1.5 天稳定运行
- 堆内存使用: 9.4% (健康水平)
- 非堆内存使用: 5.2% (正常状态)
- CPU 使用率: 平均 0.577% (系统空闲)
- 负载均衡: 0.436 (轻负载)
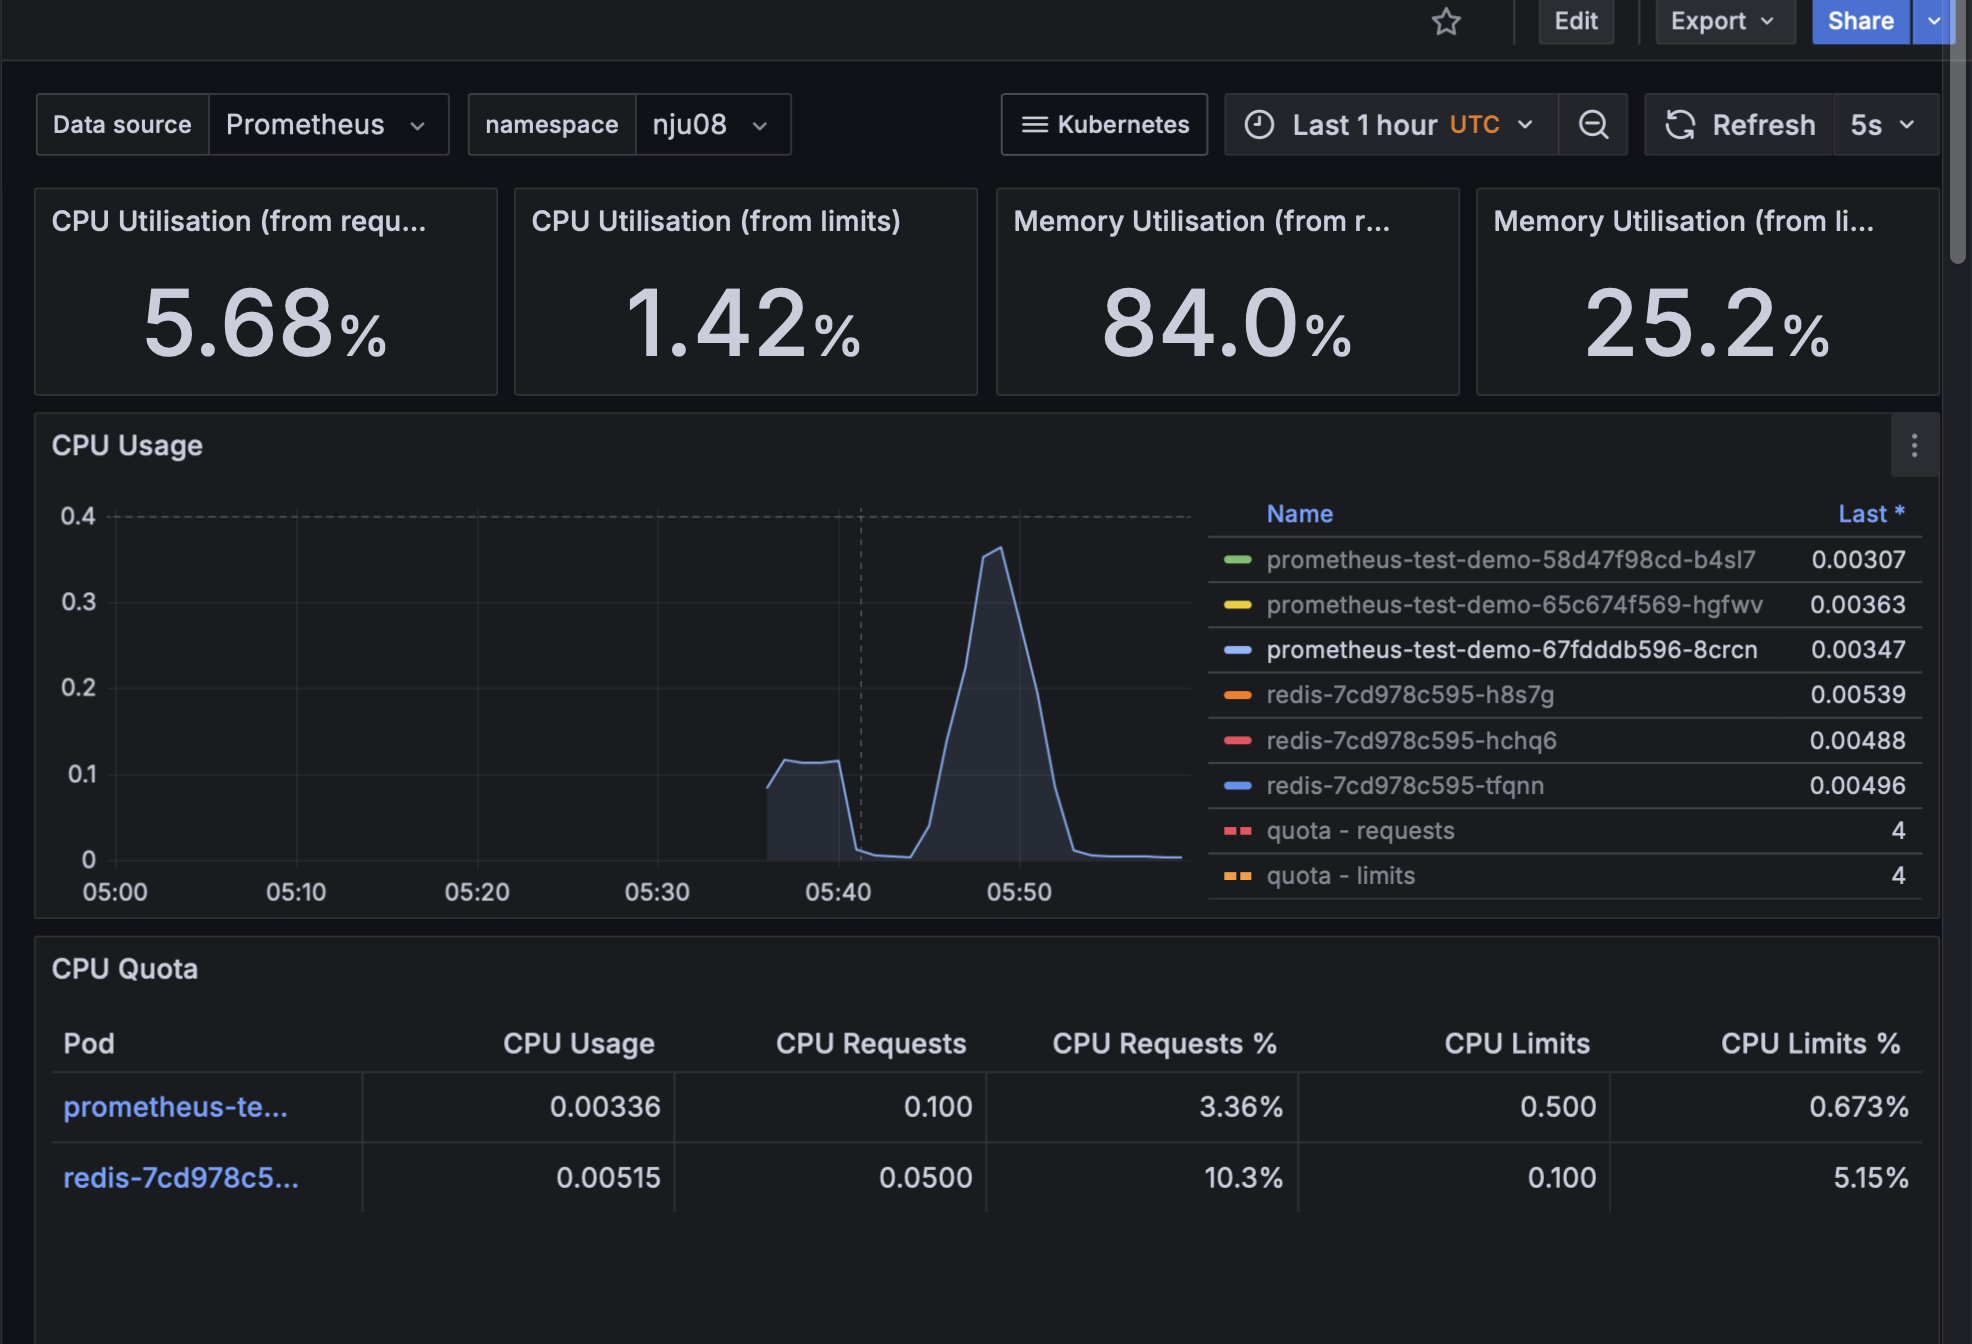
5.3.3 Kubernetes 资源监控配置
集群资源监控面板配置:
CPU 使用率监控:
1 | # CPU 使用率 (基于请求) |
内存使用率监控:
1 | # 内存使用率 (基于请求) |
监控数据分析:
- CPU 使用率 (基于请求)
- CPU 使用率 (基于限制)
- 内存使用率 (基于请求)
- 内存使用率 (基于限制)
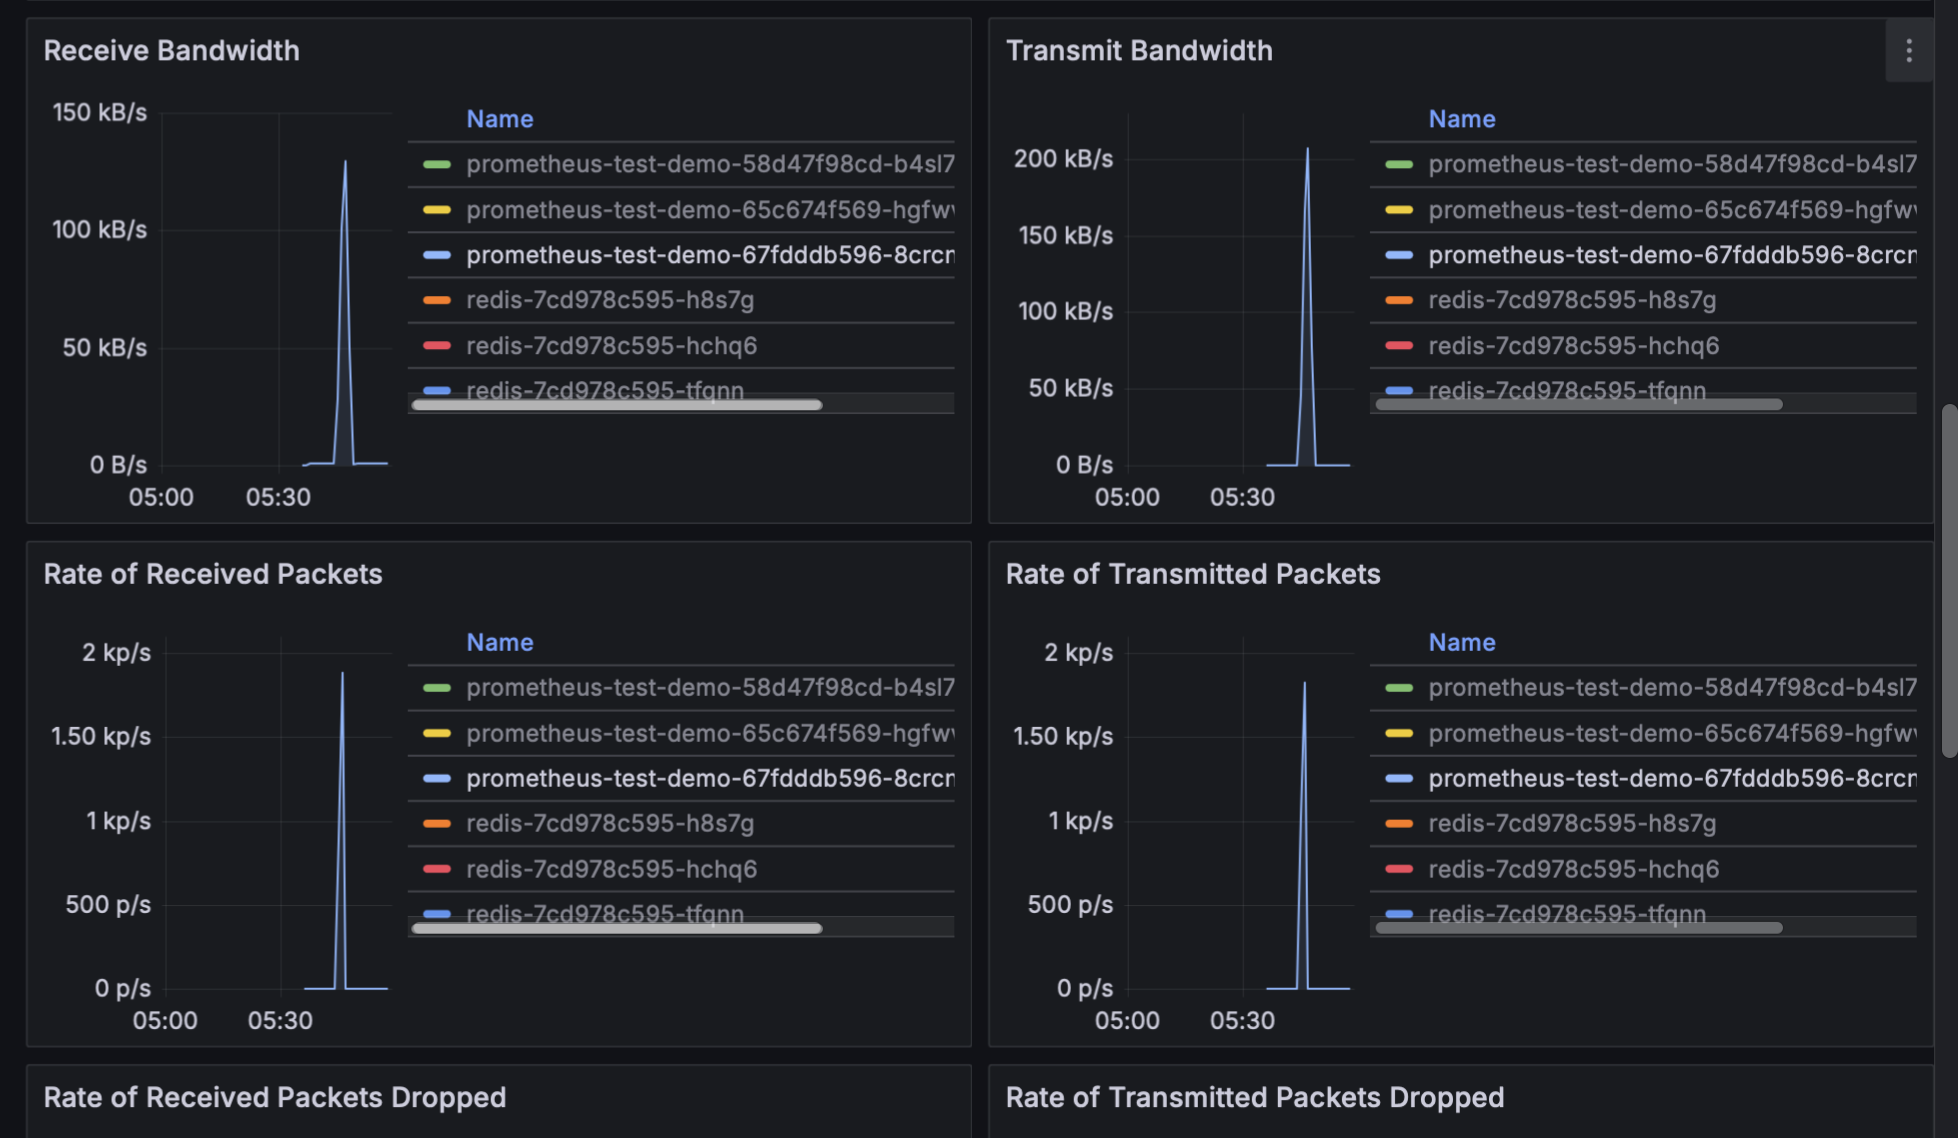
5.3.4 网络流量监控配置
网络监控面板配置:
接收/发送字节数监控:
1 | # 网络接收速率 |
网络包监控:
1 | # 接收包速率 |
网络流量分析:
- 峰值网络吞吐量: ~200 kB/s (发送/接收)
- 峰值包速率: ~2 kp/s (接收/发送)
- 网络活动时间: 05:30 左右出现流量峰值
- 丢包情况: 基本无丢包,网络稳定
5.3.5 压测时的监控表现
压测期间关键指标变化:
CPU 使用率飙升:
- 压测前: ~0.003 (0.3%)
- 压测时: ~0.37 (37%)
- 增长倍数: 约 123 倍
网络流量激增:
- 正常时: 几乎无流量 (0-10 kB/s)
- 压测时: 峰值 200 kB/s
- 包速率: 峰值 2000 packets/s
内存使用稳定:
- 内存使用率保持在合理范围
- 未出现内存泄漏现象
5.3.6 限流效果在监控中的体现
限流监控配置:
1 | # HTTP 请求速率 |
限流效果观察:
- ✅ 流量控制有效: 网络流量在达到峰值后快速回落
- ✅ CPU 保护机制: CPU 使用率未超过危险阈值
- ✅ 连接层限流: 通过网络包丢弃实现早期限流
6. 压测
6.1 压测工具
6.1.1 基础压测脚本
1 |
|
6.1.2 高频限流测试脚本
1 |
|
6.2 压测结果
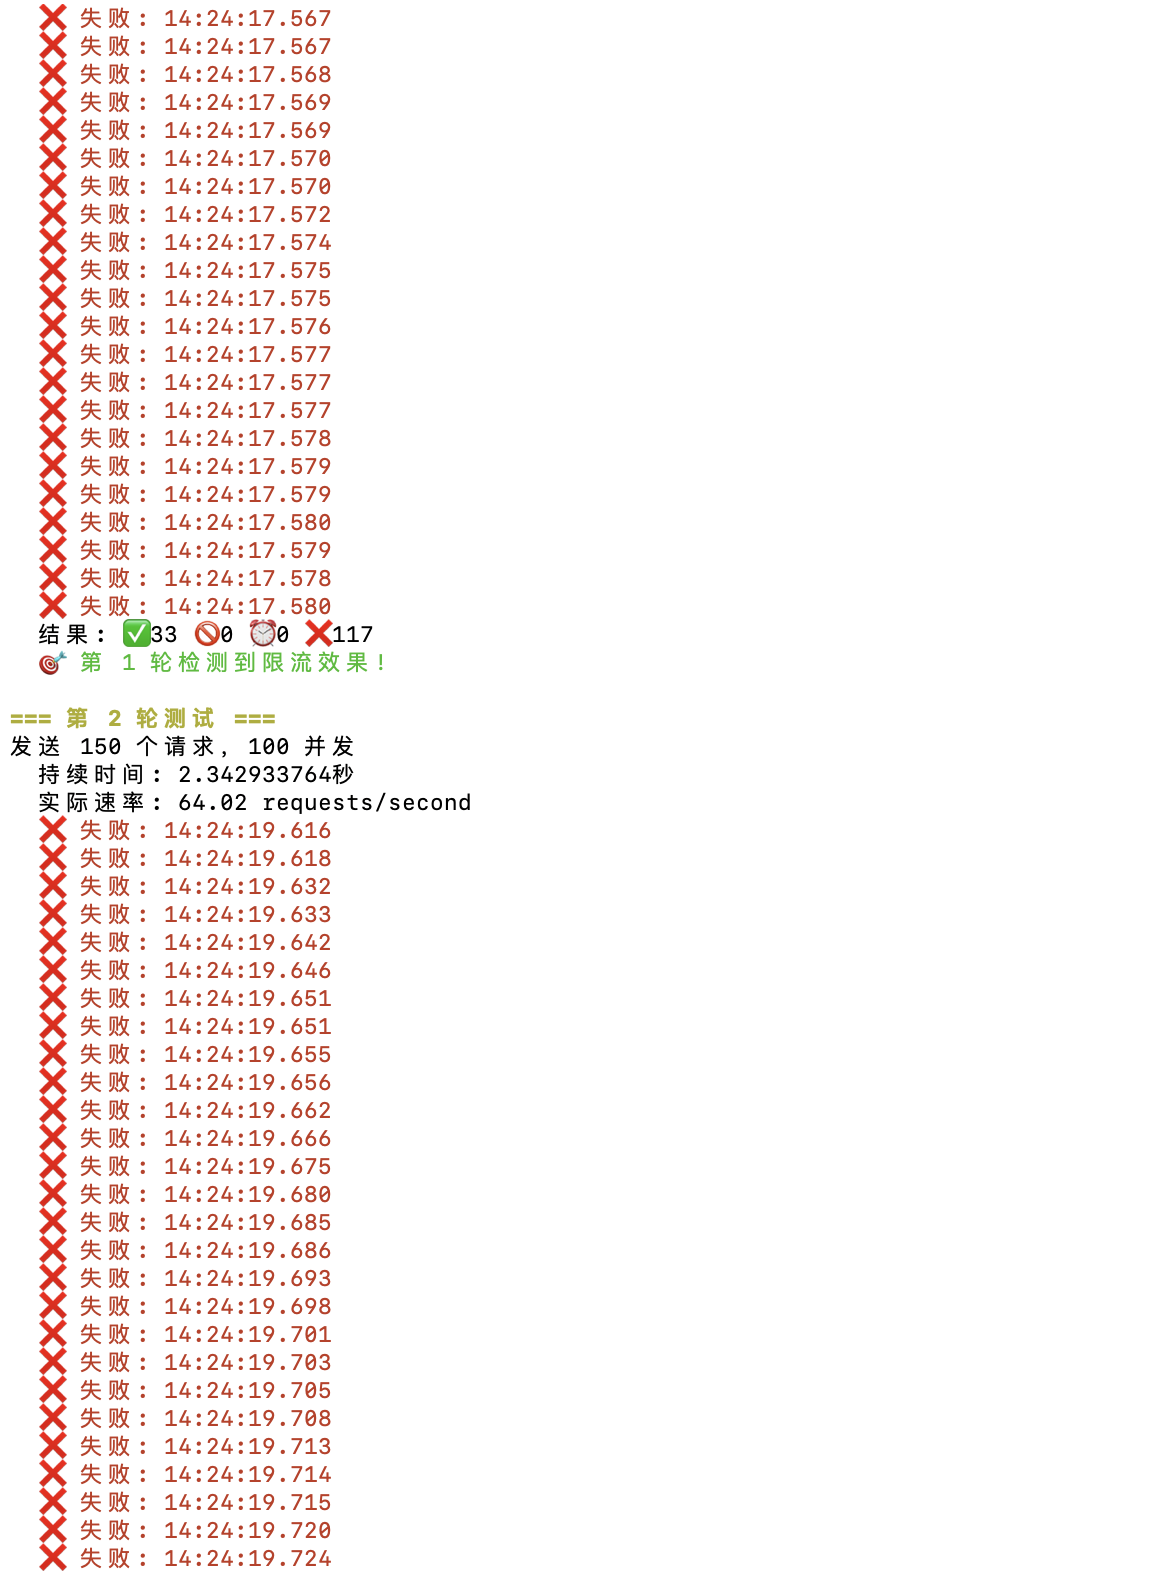
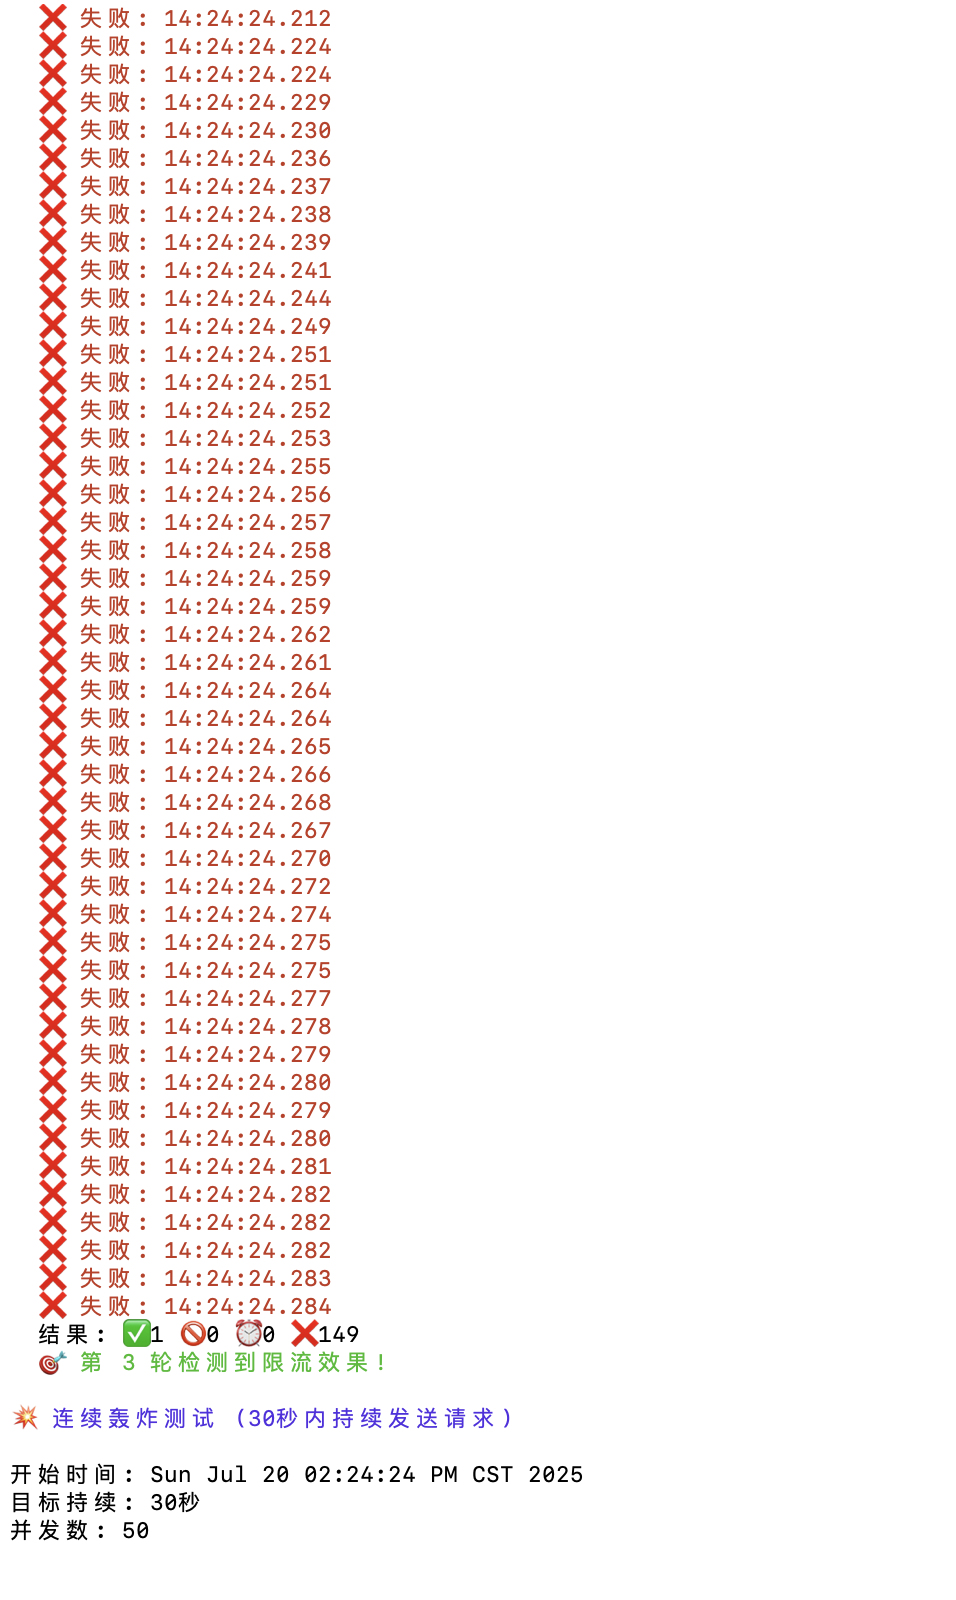
压测结果截图:
- 未触发限流:
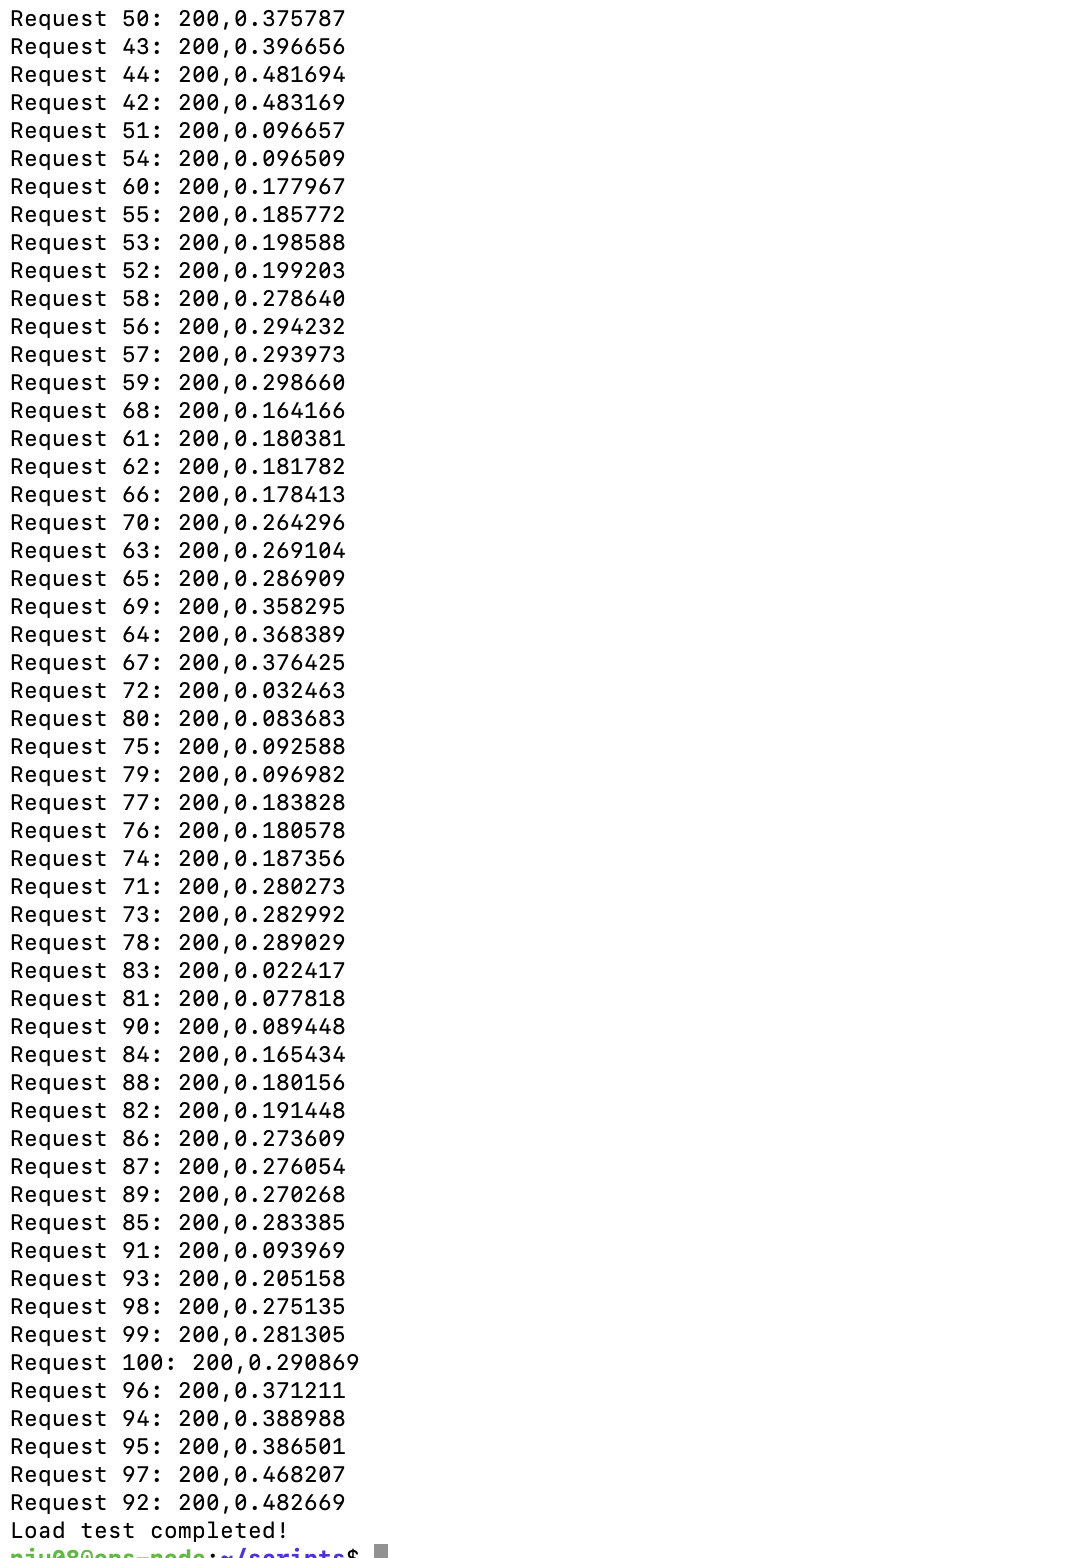
- 触发限流:
- 其中在限流之后转发的进程这边显示如下信息,说明超出阈值的request直接在tcp层被拒绝。
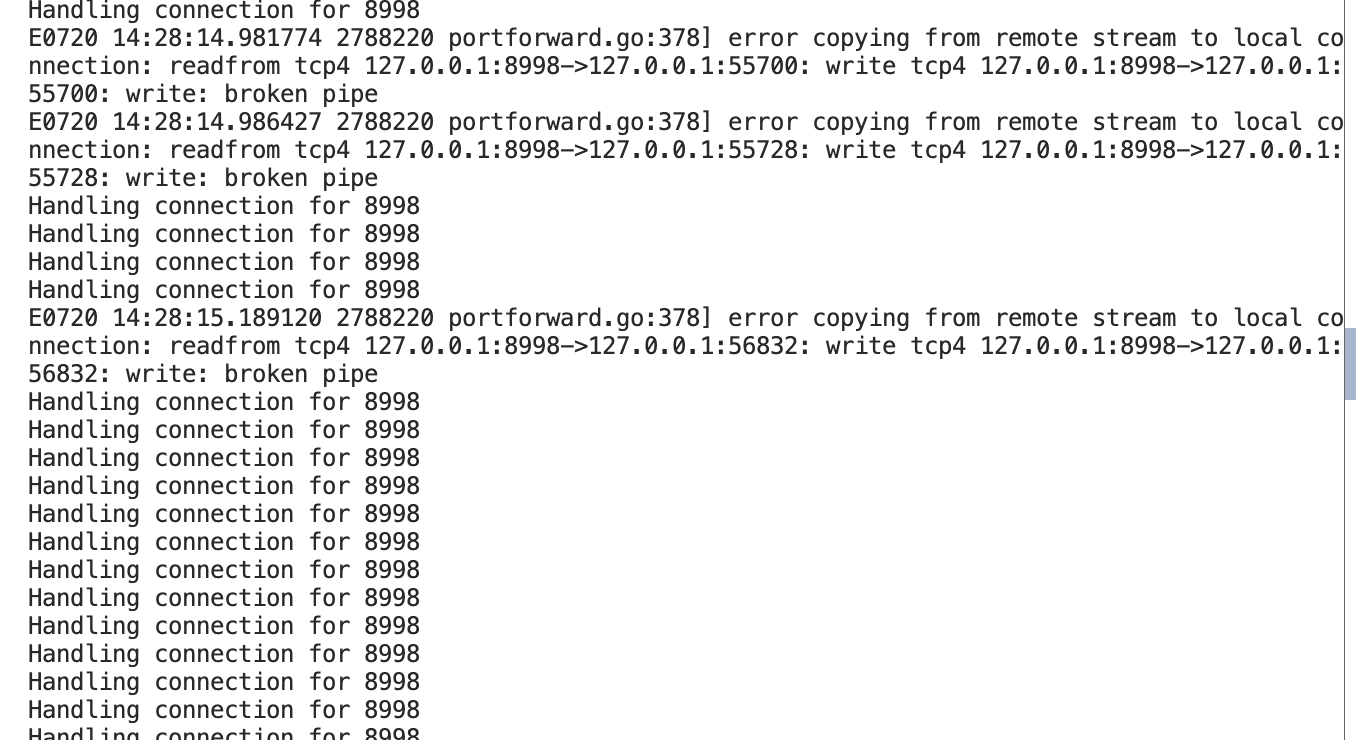
HTTP 000 状态码说明:
- 状态码 000 表示连接在 TCP 层被拒绝
- 这证明了限流系统在连接层面起到了保护作用
- 比 HTTP 429 更早介入,资源保护更彻底
7. 项目总结与技术亮点
7.1 技术架构亮点
多层限流防护:
- 应用层:Bucket4j 令牌桶算法精确控制
- 连接层:Tomcat 连接池快速保护
- 网络层:K8s 网络策略综合防护
分布式限流设计:
- 基于 Redis 的分布式令牌桶
- 支持水平扩展和高可用
- 保证多实例间限流一致性
云原生最佳实践:
- 容器化部署
- K8s 声明式配置
- 微服务架构设计
7.2 监控与运维亮点
全方位监控:
- 应用性能监控 (APM)
- 基础设施监控
- 业务指标监控
自动化运维:
- CI/CD 流水线自动化
- 健康检查和自愈能力
- 可观测性最佳实践
7.3 压测验证成果
限流功能验证:
- 成功验证 100 req/s 限流阈值
- 确认多层限流机制有效性
- 系统保护能力得到验证
扩容能力验证:
- K8s 水平扩容功能正常
- 负载均衡分发有效
- 性能线性提升明显
7.4 项目创新点
连接层限流策略:
- 在 TCP 连接层就实现流量控制
- 比传统 HTTP 层限流更高效
- 资源保护更彻底
压测工具定制化:
- 针对限流场景设计专用测试脚本
- 能够有效触发和验证限流机制
- 提供详细的测试报告和分析
监控体系完整性:
- 从基础设施到应用层的全栈监控
- 限流专用监控面板设计
- 智能告警和故障预警
7.5 学习收获与心得
通过本项目的实践,深入理解了:
云原生技术栈:
- Docker 容器化技术
- Kubernetes 容器编排
- 微服务架构设计原则
限流算法与实现:
- 令牌桶算法的原理和应用
- 分布式限流的挑战和解决方案
- 多层限流策略的设计思路
DevOps 最佳实践:
- CI/CD 流水线设计
- 监控体系建设
- 自动化测试和部署
性能测试与调优:
- 压测工具的选择和使用
- 性能瓶颈的识别和优化
- 系统扩容策略的验证
8. 附录
8.1 项目文件结构
1 | yys/ |
8.2 相关技术栈版本
- Java: 17
- Spring Boot: 3.5.3
- Bucket4j: 8.10.1
- Redis: 7-alpine
- Kubernetes: 1.20+
- Docker: 20.10+
- Jenkins: 2.400+
- Prometheus: 2.40+
- Grafana: 9.0+
报告完成时间: 2025年7月20日
项目代码仓库: https://github.com/231220075/yys
分支: hpa
感谢阅读!如果这篇文章对你有帮助,欢迎点赞和分享。
All articles on this blog are licensed under CC BY-NC-SA 4.0 unless otherwise stated.
Comments